
After showing how to use 256 colors and parsing parameters both in SQL*Plus, I now present a very interesting script (at least for me ;-)) I created that mimic the main Enterprise Manager chart in SQL*Plus.
The script builds a “chart” by using coloured blocks (or characters instead) to show active sessions broken down by Wait Class, or broken down by Wait Event for a provided Wait Class.
The script can receive a lot of parameters that control the period and other details as I present below.
Please note that the script gather information from ASH repository, so you should have Oracle Diagnostics Pack license to use it.
Here are the parameters you can provide:
- class: specify the Wait Class (just the 3 first letters are enough) to show their events breakdown. If not specified, show the Wait Classes breakdown.
- begin: begin date as a DATE expression, like sysdate-1/24.
- end: end date as a DATE expression, like sysdate-1/24.
- minutes: if a positive number is provided, the period is defined starting with &BEGIN and ending the number of minutes after that (&END parameter is ignored).
if a negative number is provided, the period is defined starting the number of minutes before now (sysdate) and ending now (&BEGIN and &END are ignored). - view: the ASH view to query. Enter D to query DBA_ACTIVE_SESS_HISTORY. Any other value will use GV$ACTIVE_SESSION_HISTORY.
- group: group (Y) or not (N) the rows by minute.
- color: define if you want to see characters instead of colors (N), 8 colors (8) or 256 colors (256).
- show: SHOW (Y) or not (N) the number of sessions for each Wait Class or Event.
- mult: the multiplier to define how many boxes will be painted for each Average Active Session. If mult=2 and there are 3 sessions, 6 (3 * 2) boxes will be painted.
- zeros: show (Y) or not (N) the samples that have no active session (especially useful when showing just one Wait Class
- inst: specify an Instance to show (for RAC environments). NULL show all instances.
Here are some examples on how to call the script:
-- Execute the script with all the default parameters:
@em

-- Show the events break down for the APPLICATION wait class, from DBA_HIST ash view, don't show samples with ZERO active sessions
@em class=app view=D zeros=n

-- Show the last 120 minutes of data, don't group by minute
@em minutes=-120 group=N

-- Show the chart from yesterday, don't show the numbers of each wait class
@em begin=trunc(sysdate-1) end=trunc(sysdate) show=n

-- Show the chart with characters instead of colors, show 3 characters for each active session
@em color=n mult=3
And here are three sample outputs:
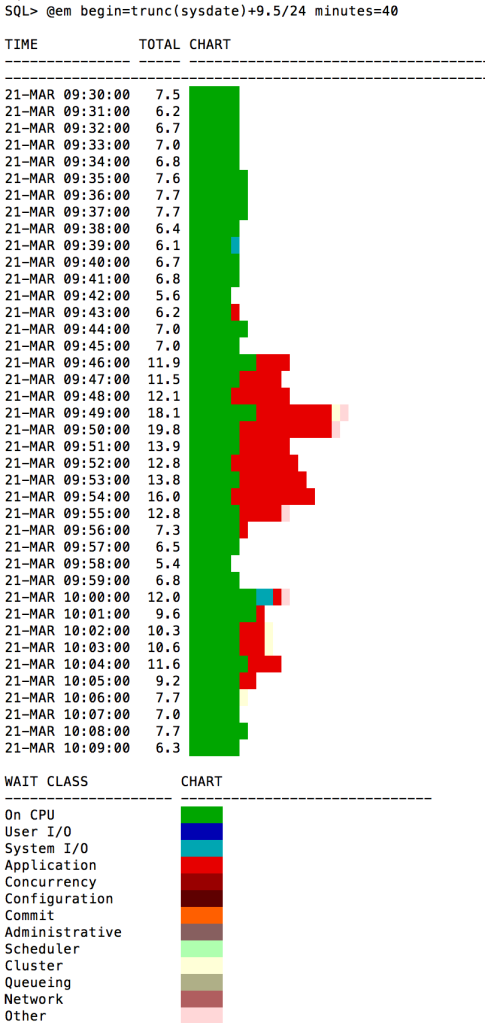
The main chart showing some Application issues
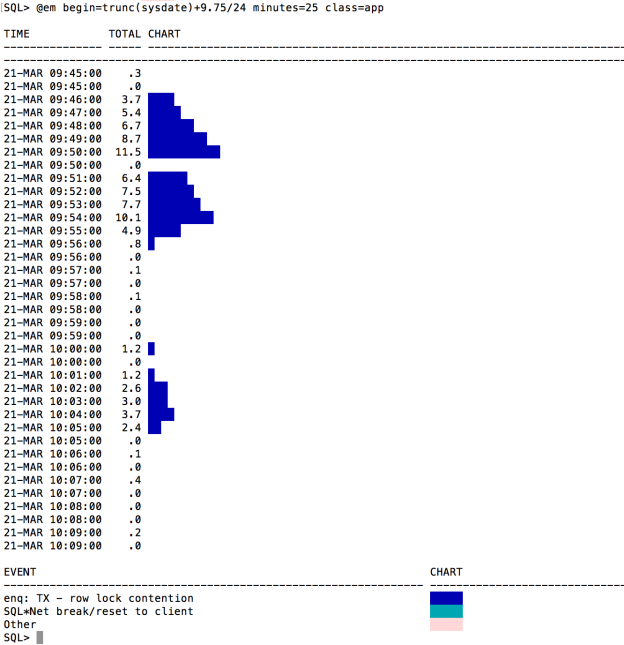
Drilling down to realize it is a row lock contention
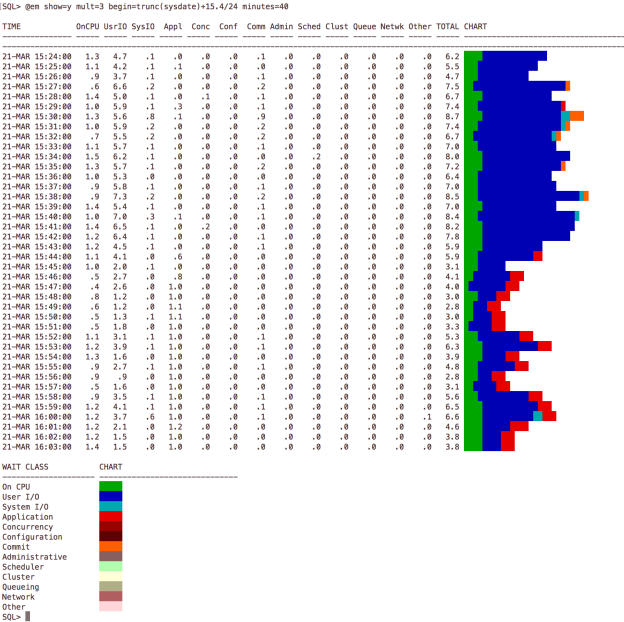
Another main chart, now showing User I/O issues
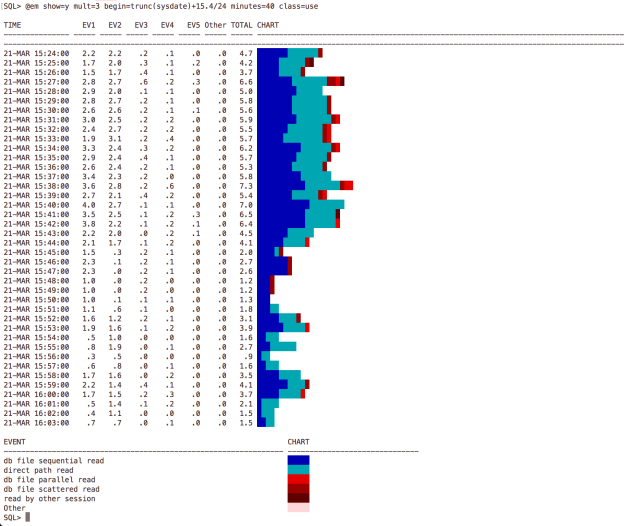
User I/O events break down

Using characters instead of colours
In the beginning of the script, right after the header, you will find the default values for every parameter. You can change the values as you like.
Please note that the main script can call some auxiliar ones: my parameters parser (read this) and one of three to define the colours (or characters) that will be used (read this).
Also note that I am using the PLAN_TABLE to save the ASH data that I will work with, just to avoid reading it many times in my subqueries. This solution is used in eDB360 and SQLd360 tools, from my fellow friends Carlos Sierra and Mauro Pagano.
So here you have the scripts. Please copy the content and save them all in the same directory. Then run em.sql as explained above. You can also download the scripts from github.
Any comments, suggestions, corrections, please let me know.
Enjoy!!!!
$cat em_nocolors.sql
define BG_ONCPU=""
define BG_USER =""
define BG_SYST =""
define BG_CONC =""
define BG_APPL =""
define BG_COMM =""
define BG_CONF =""
define BG_ADMI =""
define BG_SCHE =""
define BG_CLUS =""
define BG_QUEU =""
define BG_NETW =""
define BG_OTHE =""

define CH_ONCPU="."
define CH_USER ="U"
define CH_SYST ="S"
define CH_CONC ="C"
define CH_APPL ="A"
define CH_COMM ="M"
define CH_CONF ="F"
define CH_ADMI ="a"
define CH_SCHE ="s"
define CH_CLUS ="c"
define CH_QUEU ="q"
define CH_NETW ="n"
define CH_OTHE ="o"

define CH_EV1="1"
define CH_EV2="2"
define CH_EV3="3"
define CH_EV4="4"
define CH_EV5="5"
$cat em_8colors.sql
define BG_ONCPU="[42m"
define BG_USER ="[44m"
define BG_SYST ="[46m"
define BG_CONC ="[47m"
define BG_APPL ="[41m"
define BG_COMM ="[43m"
define BG_CONF ="[40m"
define BG_ADMI ="[34m"
define BG_SCHE ="[36m"
define BG_CLUS ="[31m"
define BG_QUEU ="[33m"
define BG_NETW ="[35m"
define BG_OTHE ="[45m"

define CH_ONCPU=" "
define CH_USER =" "
define CH_SYST =" "
define CH_CONC =" "
define CH_APPL =" "
define CH_COMM =" "
define CH_CONF =" "
define CH_ADMI ="a"
define CH_SCHE ="s"
define CH_CLUS ="c"
define CH_QUEU ="q"
define CH_NETW ="n"
define CH_OTHE ="o"

define CH_EV1=" "
define CH_EV2=" "
define CH_EV3=" "
define CH_EV4=" "
define CH_EV5=" "
$cat em_256colors.sql
define BG_ONCPU="[42m"
define BG_USER ="[44m"
define BG_SYST ="[46m"
define BG_CONC ="[48;5;1m"
define BG_APPL ="[48;5;9m"
define BG_COMM ="[48;5;202m"
define BG_CONF ="[48;5;52m"
define BG_ADMI ="[48;5;95m"
define BG_SCHE ="[48;5;157m"
define BG_CLUS ="[48;5;230m"
define BG_QUEU ="[48;5;144m"
define BG_NETW ="[48;5;131m"
define BG_OTHE ="[48;5;224m"

define CH_ONCPU=" "
define CH_USER =" "
define CH_SYST =" "
define CH_CONC =" "
define CH_APPL =" "
define CH_COMM =" "
define CH_CONF =" "
define CH_ADMI =" "
define CH_SCHE =" "
define CH_CLUS =" "
define CH_QUEU =" "
define CH_NETW =" "
define CH_OTHE =" "

define CH_EV1=" "
define CH_EV2=" "
define CH_EV3=" "
define CH_EV4=" "
define CH_EV5=" "
$cat em.sql
/*
This script emulates the EM performance chart
Created by Eduardo Claro, 2018-03-14
Last changes on 2018-03-20

WARNING: It uses ASH repository, so YOU NEED Diagnostics Pack

It can be used to display the Wait Class or the 5 main events of a specific Wait Class

Parameters (can be passed in any order in the form parameter=value)

	class    : specify the Wait Class (just the 3 first letters are enough) to show their events breakdown. If not specified, show the Wait Classes breakdown.
	begin    : begin date as a DATE expression, like sysdate-1/24.
	end      : end   date as a DATE expression, like sysdate-1/24.
	minutes  : if a positive number is provided, the period is defined starting with &BEGIN and ending the number of minutes after that (&END parameter is ignored).
	           if a negative number is provided, the period is defined starting the number of minutes before now (sysdate) and ending now (&BEGIN and &END are ignored).
	view     : the ASH view to query. Enter D to query DBA_ACTIVE_SESS_HISTORY. Any other value will use GV$ACTIVE_SESSION_HISTORY.
	group    : group (Y) or not (N) the rows by minute.
	color    : define if you want to see characters instead of colors (no), 8 colors (8) or 256 colors (256).
	show     : SHOW (Y) or not (N) the number of sessions for each Wait Class or Event.
	mult     : the multiplier to define how many boxes will be painted for each Average Active Session. If mult=2 and there are 3 sessions, 6 (3 * 2) boxes will be painted.
	zeros    : show (Y) or not (N) the samples that have no active session (especially useful when showing just one Wait Class
	inst     : specify an Instance to show (for RAC environments). NULL show all instances.

Example:

	@em
	@em class=app view=D
	@em group=N
	@em begin=sysdate-3/24 show=n

Attention:
	If the script seems to hang waiting for something, it is probably due to the SQL*Plus number variables (&1-&16) not be defined
	The SQL*Plus variables &1-&16 must be defined BEFORE running this script
	It is usually done by putting some statements in the login.sql, like this:
		set termout off
		COLUMN  1  NEW_VALUE  1    noprint
		COLUMN  2  NEW_VALUE  2    noprint
		COLUMN  3  NEW_VALUE  3    noprint
		...
		SELECT '' as "1",'' as "2",'' as "3" ... FROM dual;
		set termout on
*/

-- Default values for the parameters
define CLASS=""
define BEGIN="sysdate-1/24"
define END="sysdate"
define MINUTES=""
define VIEW=""
define GROUP=Y
define COLOR=256
define SHOW=N
define MULT=1
define ZEROS=Y
define INST=""

-- Parse the received parameters
@@parser

clear breaks
set echo off timing off ver off feed off

define RESET =[0m
alter session set nls_Date_format="dd-MON hh24:mi:ss";
set pages 500

set term off

col MULT new_value MULT
col xVIEW new_value VIEW
col xEND new_value END
col xBEGIN new_value BEGIN
col QUERY new_value QUERY
col INSTCOL new_value INSTCOL
col SCRIPT new_value SCRIPT
select
--	case when upper('&GROUP') = 'Y' then &MULT else 1 end MULT,
	case when upper('&VIEW') = 'D' then 'DBA_HIST_ACTIVE_SESS_HISTORY' else 'GV$ACTIVE_SESSION_HISTORY' end xVIEW,
	case when upper('&VIEW') = 'D' then 'INSTANCE_NUMBER' else 'INST_ID' end INSTCOL,
	case when to_number('&MINUTES') < 0 then q'[trunc(sysdate,'mi')+(&MINUTES./24/60)]' else q'[&BEGIN]' end xBEGIN,
	case when '&MINUTES' is null then q'[&END]' when to_number('&MINUTES') < 0 then 'sysdate' else q'[&BEGIN.+&MINUTES./24/60]' end xEND,
	case when '&CLASS' IS NULL then 'ash_class_final' else 'ash_event_final' end || case when upper('&SHOW') = 'N' then '2' end QUERY,
	case when '&COLOR' in ('8','256') then 'em_&COLOR.colors' else 'em_nocolors' end SCRIPT
from dual;

-- Set the colors
@@&SCRIPT

col MINUTE head "TIME"
col chart for a400 trunc
col ONCPU  for 99.9 head "OnCPU"
col USERIO for 99.9 head "UsrIO"
col SYSTIO for 99.9 head "SysIO"
col CONC   for 99.9 head "Conc"
col APPLIC for 99.9 head "Appl"
col COMM   for 99.9 head "Comm"
col CONF   for 99.9 head "Conf"
col ADMIN  for 99.9 head "Admin"
col SCHED  for 99.9 head "Sched"
col CLUST  for 99.9 head "Clust"
col QUEUE  for 99.9 head "Queue"
col NETW   for 99.9 head "Netwk"
col OTHER  for 99.9 head "Other"
col TOTAL  for 99.9 head "TOTAL"
col EV1  for 99.9
col EV2  for 99.9
col EV3  for 99.9
col EV4  for 99.9
col EV5  for 99.9

-- Using DELETE instead of TRUNCATE just for not to end a transaction in course
delete from plan_table where STATEMENT_ID = 'EM-SQLPLUS'
;
insert into plan_table (STATEMENT_ID, TIMESTAMP, REMARKS)
select
	'EM-SQLPLUS',
	cast(sample_time as date) sample_time, --remove sub-seconds difference of the RAC instances
	'ALL SAMPLES' wait_class
from &VIEW
where sample_time between &begin and &end
and ('&INST' is null OR &INSTCOL = nvl('&INST','&INSTCOL'))
;
insert into plan_table (STATEMENT_ID, TIMESTAMP, REMARKS, COST)
select
	'EM-SQLPLUS',
	cast(sample_time as date) sample_time, --remove sub-seconds difference of the RAC instances
	nvl(wait_class,'On CPU') wait_class, count(*) sessions
from &VIEW
where '&class' IS NULL and sample_time between &begin and &end
and ('&INST' is null OR &INSTCOL = nvl('&INST','&INSTCOL'))
group by cast(sample_time as date), wait_class
;
insert into plan_table (STATEMENT_ID, TIMESTAMP, REMARKS, PLAN_ID, COST)
select
	'EM-SQLPLUS',
	cast(sample_time as date) sample_time, --remove sub-seconds difference of the RAC instances
	event, event_id, count(*) sessions
from &VIEW
where '&class' IS NOT NULL and sample_time between &begin and &end
	and wait_class = (select wait_class from v$event_name where upper(wait_class) like upper('&class%') and rownum = 1)
and ('&INST' is null OR &INSTCOL = nvl('&INST','&INSTCOL'))
group by cast(sample_time as date), event, event_id
;
set term on

WITH
ash_allsamples AS (
	select distinct
		TIMESTAMP sample_time
	from plan_table
	where STATEMENT_ID = 'EM-SQLPLUS' and REMARKS = 'ALL SAMPLES'
),
ash_class AS (
	select * from (
		select TIMESTAMP sample_time, REMARKS wait_class, COST sessions,
			count(distinct TIMESTAMP) over (partition by trunc(TIMESTAMP,'MI')) SAMPLES_PER_MIN
		from plan_table
		where STATEMENT_ID = 'EM-SQLPLUS'
	) where wait_class  'ALL SAMPLES'
),
ash_event AS (
	select * from (
		select TIMESTAMP sample_time, REMARKS event, PLAN_ID event_id, COST sessions,
			count(distinct TIMESTAMP) over (partition by trunc(TIMESTAMP,'MI')) SAMPLES_PER_MIN
		from plan_table
		where STATEMENT_ID = 'EM-SQLPLUS'
	) where event  'ALL SAMPLES'
),
ash_mainevents AS (
	select
		event, position
	from (
		select
			event,
			rank() over (order by sum(sessions) desc, event_id) position
		from ash_event
		group by event, event_id
		order by sum(sessions) desc
	)
	where position  0)
/

col CHART for a30
col xGROUP head "WAIT CLASS" for a20 trunc
SELECT * FROM (
	select 'On CPU'         xGROUP, '&BG_ONCPU' || lpad('&CH_ONCPU', 5 , '&CH_ONCPU') || '&RESET' chart from dual UNION ALL
	select 'User I/O'       xGROUP, '&BG_USER'  || lpad('&CH_USER' , 5 , '&CH_USER' ) || '&RESET' chart from dual UNION ALL
	select 'System I/O'     xGROUP, '&BG_SYST'  || lpad('&CH_SYST' , 5 , '&CH_SYST' ) || '&RESET' chart from dual UNION ALL
	select 'Application'    xGROUP, '&BG_APPL'  || lpad('&CH_APPL' , 5 , '&CH_APPL' ) || '&RESET' chart from dual UNION ALL
	select 'Concurrency'    xGROUP, '&BG_CONC'  || lpad('&CH_CONC' , 5 , '&CH_CONC' ) || '&RESET' chart from dual UNION ALL
	select 'Configuration'  xGROUP, '&BG_CONF'  || lpad('&CH_CONF' , 5 , '&CH_CONF' ) || '&RESET' chart from dual UNION ALL
	select 'Commit'         xGROUP, '&BG_COMM'  || lpad('&CH_COMM' , 5 , '&CH_COMM' ) || '&RESET' chart from dual UNION ALL
	select 'Administrative' xGROUP, '&BG_ADMI'  || lpad('&CH_ADMI' , 5 , '&CH_ADMI' ) || '&RESET' chart from dual UNION ALL
	select 'Scheduler'      xGROUP, '&BG_SCHE'  || lpad('&CH_SCHE' , 5 , '&CH_SCHE' ) || '&RESET' chart from dual UNION ALL
	select 'Cluster'        xGROUP, '&BG_CLUS'  || lpad('&CH_CLUS' , 5 , '&CH_CLUS' ) || '&RESET' chart from dual UNION ALL
	select 'Queueing'       xGROUP, '&BG_QUEU'  || lpad('&CH_QUEU' , 5 , '&CH_QUEU' ) || '&RESET' chart from dual UNION ALL
	select 'Network'        xGROUP, '&BG_NETW'  || lpad('&CH_NETW' , 5 , '&CH_NETW' ) || '&RESET' chart from dual UNION ALL
	select 'Other'          xGROUP, '&BG_OTHE'  || lpad('&CH_OTHE' , 5 , '&CH_OTHE' ) || '&RESET' chart from dual
) WHERE '&class' IS NULL
;
col xGROUP head "EVENT" for a64 trunc
WITH events AS (
	select
		event, position
	from (
		select
			REMARKS event,
			rank() over (order by SUM(COST) desc, PLAN_ID) position
		from plan_table
		where STATEMENT_ID = 'EM-SQLPLUS' and REMARKS  'ALL SAMPLES'
		group by REMARKS, PLAN_ID
		order by SUM(COST) desc
	)
	where position <= 5
)
select * from (
	select event   xGROUP, '&BG_USER'  || lpad('&CH_EV1' , 5 , '&CH_EV1' ) || '&RESET' chart from events WHERE position = 1 UNION ALL
	select event   xGROUP, '&BG_SYST'  || lpad('&CH_EV2' , 5 , '&CH_EV2' ) || '&RESET' chart from events WHERE position = 2 UNION ALL
	select event   xGROUP, '&BG_APPL'  || lpad('&CH_EV3' , 5 , '&CH_EV3' ) || '&RESET' chart from events WHERE position = 3 UNION ALL
	select event   xGROUP, '&BG_CONC'  || lpad('&CH_EV4' , 5 , '&CH_EV4' ) || '&RESET' chart from events WHERE position = 4 UNION ALL
	select event   xGROUP, '&BG_CONF'  || lpad('&CH_EV5' , 5 , '&CH_EV5' ) || '&RESET' chart from events WHERE position = 5 UNION ALL
	select 'Other' xGROUP, '&BG_OTHE'  || lpad('&CH_OTHE' , 5 , '&CH_OTHE' ) || '&RESET' chart from dual
) WHERE '&class' IS NOT NULL
;

define 1=""
define 2=""
define 3=""
define 4=""
define 5=""
define 6=""
define 7=""
define 8=""
define 9=""
define 10=""
define 11=""
define 12=""
define 13=""
define 14=""
define 15=""
define 16=""
Um gráfico do Enterprise Manager no SQL*Plus
Depois de mostrar como usar 256 cores and como definir parâmetros no SQL*Plus, eu agora apresento um script bem interessante (pelo menos pra mim ;-)) que eu criei e imita o gráfico principal do Enterprise Manager no SQL*Plus.
O script constrói um “gráfico” usando blocos coloridos (ou caracteres) para mostrar sessões ativas por Wait Class, or por evento para uma Wait Class fornecida.
O script pode receber vários parâmetros que controlam o período e outros detalhes que eu explico abaixo.
Note que o script coleta informação do repositório do ASH, e portanto você deve ter licença do Oracle Diagnostics Pack para utilizá-lo.
Aqui estão os parâmetros que você pode fornecer:
- class: define uma Wait Class (apenas as 3 primeiras letras são suficientes) para mostrar seus eventos. Se não especificado, mostra as sessões para cadaWait Class.
- begin: data inicial em uma expressão tipo DATE, como em sysdate-1/24.
- end: data final em uma expressão tipo DATE, como em sysdate-1/24.
- minutes: se for um número positivo, o período é definido começando em &BEGIN e terminando após o número de minutos fornecido (o parâmetro &END é ignorado).
se for um número negativo, o período é definido começando o número de minutos antes de agora (sysdate) e terminando agora (&BEGIN e &END são ignorados). - view: a view do ASH a ser consultada. Entre D para consultar a DBA_ACTIVE_SESS_HISTORY. Qualquer outro valor vai usar a view GV$ACTIVE_SESSION_HISTORY.
- group: agrupa (Y) ou não (N) as linhas por minuto.
- color: define se você quer ver characteres (N), 8 cores (8) ou 256 cores (256).
- show: mostra (Y) ou não (N) a quantidade de sessões para cadaWait Class ou evento.
- mult: o multiplicador que define quantos blocos coloridos serão mostrados para cada sessão ativa. Se mult=2 e há 3 sessões, 6 (3 * 2) blocos serão mostrados.
- zeros: mostra (Y) ou não (N) os momentos em que não houve sessão ativa (especialmente útil quando mostrando os eventos de uma Wait Class).
- inst: especifique uma instância do RAC para mostrar. NULL show all instances.
Aqui estão alguns exemplos de como executar o script:
-- Execute the script with all the default parameters:
@em

-- Show the events break down for the APPLICATION wait class, from DBA_HIST ash view, don't show samples with ZERO active sessions
@em class=app view=D zeros=n

-- Show the last 120 minutes of data, don't group by minute
@em minutes=-120 group=N

-- Show the chart from yesterday, don't show the numbers of each wait class
@em begin=trunc(sysdate-1) end=trunc(sysdate) show=n

-- Show the chart with characters instead of colors, show 3 characters for each active session
@em color=n mult=3
E aqui alguns exemplos de resultado:
O gráfico principal mostrando alguns problemas de Aplicação
Aprofundando para verificar que o problema era de lock de linhas
Outro gráfico principal, agora mostrando predominância de User I/O
Quebrando os eventos de User I/O
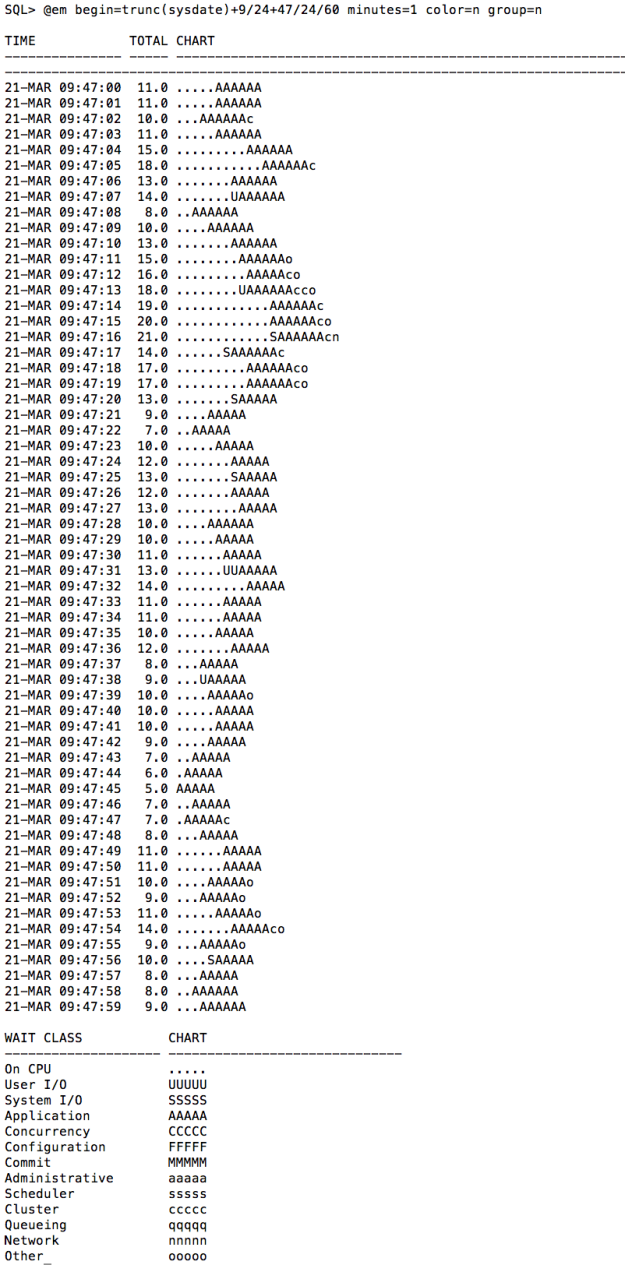
Usando caracteres ao invés de cores
No início do script, logo depois do cabeçalho, você vai encontrar os valores default para cada parâmetro. Você pode mudar os valores como quiser.
Note que o script principal pode chamar alguns auxiliares: o meu parser (leia isto) e um dos três para definir as cores (ou caracteres) que serão usados (leia isto).
Note também que eu estou usando a PLAN_TABLE para salvar os dados do ASH que em seguida vou processar, pra evitar de ter que lê-los várias vezes do repositório. Essa solução é utilizada nas ferramentas eDB360 and SQLd360 tools, dos meus amigos Carlos Sierra e Mauro Pagano.
Aqui estão os scripts. Copie o conteúdo e salve-os no mesmo diretório. Então rode o em.sql como explicado acima. Você também pode baixar os scripts do github.
Qualquer comentário, sugestão, correção, por favor me avise.
Divirtam-se!!!!
$cat em_nocolors.sql
define BG_ONCPU=""
define BG_USER =""
define BG_SYST =""
define BG_CONC =""
define BG_APPL =""
define BG_COMM =""
define BG_CONF =""
define BG_ADMI =""
define BG_SCHE =""
define BG_CLUS =""
define BG_QUEU =""
define BG_NETW =""
define BG_OTHE =""

define CH_ONCPU="."
define CH_USER ="U"
define CH_SYST ="S"
define CH_CONC ="C"
define CH_APPL ="A"
define CH_COMM ="M"
define CH_CONF ="F"
define CH_ADMI ="a"
define CH_SCHE ="s"
define CH_CLUS ="c"
define CH_QUEU ="q"
define CH_NETW ="n"
define CH_OTHE ="o"

define CH_EV1="1"
define CH_EV2="2"
define CH_EV3="3"
define CH_EV4="4"
define CH_EV5="5"
$cat em_8colors.sql
define BG_ONCPU="[42m"
define BG_USER ="[44m"
define BG_SYST ="[46m"
define BG_CONC ="[47m"
define BG_APPL ="[41m"
define BG_COMM ="[43m"
define BG_CONF ="[40m"
define BG_ADMI ="[34m"
define BG_SCHE ="[36m"
define BG_CLUS ="[31m"
define BG_QUEU ="[33m"
define BG_NETW ="[35m"
define BG_OTHE ="[45m"

define CH_ONCPU=" "
define CH_USER =" "
define CH_SYST =" "
define CH_CONC =" "
define CH_APPL =" "
define CH_COMM =" "
define CH_CONF =" "
define CH_ADMI ="a"
define CH_SCHE ="s"
define CH_CLUS ="c"
define CH_QUEU ="q"
define CH_NETW ="n"
define CH_OTHE ="o"

define CH_EV1=" "
define CH_EV2=" "
define CH_EV3=" "
define CH_EV4=" "
define CH_EV5=" "
$cat em_256colors.sql
define BG_ONCPU="[42m"
define BG_USER ="[44m"
define BG_SYST ="[46m"
define BG_CONC ="[48;5;1m"
define BG_APPL ="[48;5;9m"
define BG_COMM ="[48;5;202m"
define BG_CONF ="[48;5;52m"
define BG_ADMI ="[48;5;95m"
define BG_SCHE ="[48;5;157m"
define BG_CLUS ="[48;5;230m"
define BG_QUEU ="[48;5;144m"
define BG_NETW ="[48;5;131m"
define BG_OTHE ="[48;5;224m"

define CH_ONCPU=" "
define CH_USER =" "
define CH_SYST =" "
define CH_CONC =" "
define CH_APPL =" "
define CH_COMM =" "
define CH_CONF =" "
define CH_ADMI =" "
define CH_SCHE =" "
define CH_CLUS =" "
define CH_QUEU =" "
define CH_NETW =" "
define CH_OTHE =" "

define CH_EV1=" "
define CH_EV2=" "
define CH_EV3=" "
define CH_EV4=" "
define CH_EV5=" "
$cat em.sql
/*
This script emulates the EM performance chart
Created by Eduardo Claro, 2018-03-14
Last changes on 2018-03-20

WARNING: It uses ASH repository, so YOU NEED Diagnostics Pack

It can be used to display the Wait Class or the 5 main events of a specific Wait Class

Parameters (can be passed in any order in the form parameter=value)

	class    : specify the Wait Class (just the 3 first letters are enough) to show their events breakdown. If not specified, show the Wait Classes breakdown.
	begin    : begin date as a DATE expression, like sysdate-1/24.
	end      : end   date as a DATE expression, like sysdate-1/24.
	minutes  : if a positive number is provided, the period is defined starting with &BEGIN and ending the number of minutes after that (&END parameter is ignored).
	           if a negative number is provided, the period is defined starting the number of minutes before now (sysdate) and ending now (&BEGIN and &END are ignored).
	view     : the ASH view to query. Enter D to query DBA_ACTIVE_SESS_HISTORY. Any other value will use GV$ACTIVE_SESSION_HISTORY.
	group    : group (Y) or not (N) the rows by minute.
	color    : define if you want to see characters instead of colors (no), 8 colors (8) or 256 colors (256).
	show     : SHOW (Y) or not (N) the number of sessions for each Wait Class or Event.
	mult     : the multiplier to define how many boxes will be painted for each Average Active Session. If mult=2 and there are 3 sessions, 6 (3 * 2) boxes will be painted.
	zeros    : show (Y) or not (N) the samples that have no active session (especially useful when showing just one Wait Class
	inst     : specify an Instance to show (for RAC environments). NULL show all instances.

Example:

	@em
	@em class=app view=D
	@em group=N
	@em begin=sysdate-3/24 show=n

Attention:
	If the script seems to hang waiting for something, it is probably due to the SQL*Plus number variables (&1-&16) not be defined
	The SQL*Plus variables &1-&16 must be defined BEFORE running this script
	It is usually done by putting some statements in the login.sql, like this:
		set termout off
		COLUMN  1  NEW_VALUE  1    noprint
		COLUMN  2  NEW_VALUE  2    noprint
		COLUMN  3  NEW_VALUE  3    noprint
		...
		SELECT '' as "1",'' as "2",'' as "3" ... FROM dual;
		set termout on
*/

-- Default values for the parameters
define CLASS=""
define BEGIN="sysdate-1/24"
define END="sysdate"
define MINUTES=""
define VIEW=""
define GROUP=Y
define COLOR=256
define SHOW=N
define MULT=1
define ZEROS=Y
define INST=""

-- Parse the received parameters
@@parser

clear breaks
set echo off timing off ver off feed off

define RESET =[0m
alter session set nls_Date_format="dd-MON hh24:mi:ss";
set pages 500

set term off

col MULT new_value MULT
col xVIEW new_value VIEW
col xEND new_value END
col xBEGIN new_value BEGIN
col QUERY new_value QUERY
col INSTCOL new_value INSTCOL
col SCRIPT new_value SCRIPT
select
--	case when upper('&GROUP') = 'Y' then &MULT else 1 end MULT,
	case when upper('&VIEW') = 'D' then 'DBA_HIST_ACTIVE_SESS_HISTORY' else 'GV$ACTIVE_SESSION_HISTORY' end xVIEW,
	case when upper('&VIEW') = 'D' then 'INSTANCE_NUMBER' else 'INST_ID' end INSTCOL,
	case when to_number('&MINUTES') < 0 then q'[trunc(sysdate,'mi')+(&MINUTES./24/60)]' else q'[&BEGIN]' end xBEGIN,
	case when '&MINUTES' is null then q'[&END]' when to_number('&MINUTES') < 0 then 'sysdate' else q'[&BEGIN.+&MINUTES./24/60]' end xEND,
	case when '&CLASS' IS NULL then 'ash_class_final' else 'ash_event_final' end || case when upper('&SHOW') = 'N' then '2' end QUERY,
	case when '&COLOR' in ('8','256') then 'em_&COLOR.colors' else 'em_nocolors' end SCRIPT
from dual;

-- Set the colors
@@&SCRIPT

col MINUTE head "TIME"
col chart for a400 trunc
col ONCPU  for 99.9 head "OnCPU"
col USERIO for 99.9 head "UsrIO"
col SYSTIO for 99.9 head "SysIO"
col CONC   for 99.9 head "Conc"
col APPLIC for 99.9 head "Appl"
col COMM   for 99.9 head "Comm"
col CONF   for 99.9 head "Conf"
col ADMIN  for 99.9 head "Admin"
col SCHED  for 99.9 head "Sched"
col CLUST  for 99.9 head "Clust"
col QUEUE  for 99.9 head "Queue"
col NETW   for 99.9 head "Netwk"
col OTHER  for 99.9 head "Other"
col TOTAL  for 99.9 head "TOTAL"
col EV1  for 99.9
col EV2  for 99.9
col EV3  for 99.9
col EV4  for 99.9
col EV5  for 99.9

-- Using DELETE instead of TRUNCATE just for not to end a transaction in course
delete from plan_table where STATEMENT_ID = 'EM-SQLPLUS'
;
insert into plan_table (STATEMENT_ID, TIMESTAMP, REMARKS)
select
	'EM-SQLPLUS',
	cast(sample_time as date) sample_time, --remove sub-seconds difference of the RAC instances
	'ALL SAMPLES' wait_class
from &VIEW
where sample_time between &begin and &end
and ('&INST' is null OR &INSTCOL = nvl('&INST','&INSTCOL'))
;
insert into plan_table (STATEMENT_ID, TIMESTAMP, REMARKS, COST)
select
	'EM-SQLPLUS',
	cast(sample_time as date) sample_time, --remove sub-seconds difference of the RAC instances
	nvl(wait_class,'On CPU') wait_class, count(*) sessions
from &VIEW
where '&class' IS NULL and sample_time between &begin and &end
and ('&INST' is null OR &INSTCOL = nvl('&INST','&INSTCOL'))
group by cast(sample_time as date), wait_class
;
insert into plan_table (STATEMENT_ID, TIMESTAMP, REMARKS, PLAN_ID, COST)
select
	'EM-SQLPLUS',
	cast(sample_time as date) sample_time, --remove sub-seconds difference of the RAC instances
	event, event_id, count(*) sessions
from &VIEW
where '&class' IS NOT NULL and sample_time between &begin and &end
	and wait_class = (select wait_class from v$event_name where upper(wait_class) like upper('&class%') and rownum = 1)
and ('&INST' is null OR &INSTCOL = nvl('&INST','&INSTCOL'))
group by cast(sample_time as date), event, event_id
;
set term on

WITH
ash_allsamples AS (
	select distinct
		TIMESTAMP sample_time
	from plan_table
	where STATEMENT_ID = 'EM-SQLPLUS' and REMARKS = 'ALL SAMPLES'
),
ash_class AS (
	select * from (
		select TIMESTAMP sample_time, REMARKS wait_class, COST sessions,
			count(distinct TIMESTAMP) over (partition by trunc(TIMESTAMP,'MI')) SAMPLES_PER_MIN
		from plan_table
		where STATEMENT_ID = 'EM-SQLPLUS'
	) where wait_class  'ALL SAMPLES'
),
ash_event AS (
	select * from (
		select TIMESTAMP sample_time, REMARKS event, PLAN_ID event_id, COST sessions,
			count(distinct TIMESTAMP) over (partition by trunc(TIMESTAMP,'MI')) SAMPLES_PER_MIN
		from plan_table
		where STATEMENT_ID = 'EM-SQLPLUS'
	) where event  'ALL SAMPLES'
),
ash_mainevents AS (
	select
		event, position
	from (
		select
			event,
			rank() over (order by sum(sessions) desc, event_id) position
		from ash_event
		group by event, event_id
		order by sum(sessions) desc
	)
	where position  0)
/

col CHART for a30
col xGROUP head "WAIT CLASS" for a20 trunc
SELECT * FROM (
	select 'On CPU'         xGROUP, '&BG_ONCPU' || lpad('&CH_ONCPU', 5 , '&CH_ONCPU') || '&RESET' chart from dual UNION ALL
	select 'User I/O'       xGROUP, '&BG_USER'  || lpad('&CH_USER' , 5 , '&CH_USER' ) || '&RESET' chart from dual UNION ALL
	select 'System I/O'     xGROUP, '&BG_SYST'  || lpad('&CH_SYST' , 5 , '&CH_SYST' ) || '&RESET' chart from dual UNION ALL
	select 'Application'    xGROUP, '&BG_APPL'  || lpad('&CH_APPL' , 5 , '&CH_APPL' ) || '&RESET' chart from dual UNION ALL
	select 'Concurrency'    xGROUP, '&BG_CONC'  || lpad('&CH_CONC' , 5 , '&CH_CONC' ) || '&RESET' chart from dual UNION ALL
	select 'Configuration'  xGROUP, '&BG_CONF'  || lpad('&CH_CONF' , 5 , '&CH_CONF' ) || '&RESET' chart from dual UNION ALL
	select 'Commit'         xGROUP, '&BG_COMM'  || lpad('&CH_COMM' , 5 , '&CH_COMM' ) || '&RESET' chart from dual UNION ALL
	select 'Administrative' xGROUP, '&BG_ADMI'  || lpad('&CH_ADMI' , 5 , '&CH_ADMI' ) || '&RESET' chart from dual UNION ALL
	select 'Scheduler'      xGROUP, '&BG_SCHE'  || lpad('&CH_SCHE' , 5 , '&CH_SCHE' ) || '&RESET' chart from dual UNION ALL
	select 'Cluster'        xGROUP, '&BG_CLUS'  || lpad('&CH_CLUS' , 5 , '&CH_CLUS' ) || '&RESET' chart from dual UNION ALL
	select 'Queueing'       xGROUP, '&BG_QUEU'  || lpad('&CH_QUEU' , 5 , '&CH_QUEU' ) || '&RESET' chart from dual UNION ALL
	select 'Network'        xGROUP, '&BG_NETW'  || lpad('&CH_NETW' , 5 , '&CH_NETW' ) || '&RESET' chart from dual UNION ALL
	select 'Other'          xGROUP, '&BG_OTHE'  || lpad('&CH_OTHE' , 5 , '&CH_OTHE' ) || '&RESET' chart from dual
) WHERE '&class' IS NULL
;
col xGROUP head "EVENT" for a64 trunc
WITH events AS (
	select
		event, position
	from (
		select
			REMARKS event,
			rank() over (order by SUM(COST) desc, PLAN_ID) position
		from plan_table
		where STATEMENT_ID = 'EM-SQLPLUS' and REMARKS  'ALL SAMPLES'
		group by REMARKS, PLAN_ID
		order by SUM(COST) desc
	)
	where position <= 5
)
select * from (
	select event   xGROUP, '&BG_USER'  || lpad('&CH_EV1' , 5 , '&CH_EV1' ) || '&RESET' chart from events WHERE position = 1 UNION ALL
	select event   xGROUP, '&BG_SYST'  || lpad('&CH_EV2' , 5 , '&CH_EV2' ) || '&RESET' chart from events WHERE position = 2 UNION ALL
	select event   xGROUP, '&BG_APPL'  || lpad('&CH_EV3' , 5 , '&CH_EV3' ) || '&RESET' chart from events WHERE position = 3 UNION ALL
	select event   xGROUP, '&BG_CONC'  || lpad('&CH_EV4' , 5 , '&CH_EV4' ) || '&RESET' chart from events WHERE position = 4 UNION ALL
	select event   xGROUP, '&BG_CONF'  || lpad('&CH_EV5' , 5 , '&CH_EV5' ) || '&RESET' chart from events WHERE position = 5 UNION ALL
	select 'Other' xGROUP, '&BG_OTHE'  || lpad('&CH_OTHE' , 5 , '&CH_OTHE' ) || '&RESET' chart from dual
) WHERE '&class' IS NOT NULL
;

define 1=""
define 2=""
define 3=""
define 4=""
define 5=""
define 6=""
define 7=""
define 8=""
define 9=""
define 10=""
define 11=""
define 12=""
define 13=""
define 14=""
define 15=""
define 16=""

Howdy, which version of the sql*plus did you use? Thanks
LikeLike
I used 11.2.0.4, but I think it works on virtually every version, because it uses resources from the terminal.
LikeLike
Kudos for the initiative and the brilliant idea !
I have anyways huge difficulties to have a proper display. I have tried with 11gR2 and 12cR1…
LikeLike
Hi Yannick. The colours will show up when you connect to a Linux/Unix Oracle server thru a color capable terminal. If you are trying to use Command Prompt from Windows, it won’t work. You can use PuTTY for example, to connect from a Windows client.
LikeLike
Hi Eduardo,
Sorry was not clear, all the Putty and so on stuff is clear, I’m already using it in home made scripts.
Trying to share a display (11gR2 and 12cR1):
https://imgur.com/a/WTnbz
LikeLike