Tag Archives: oracle

How PARANOID are you with data? Or are there DIRTY READs in Oracle???

Some weeks ago, I was discussing with a friend about an issue he saw in some Oracle databases, kind of losing data, or in other words, seeing UNCOMMITTED data that later on disappeared.

Allowing a session to read uncommited data being changed in another transaction is a Transaction Isolation Level called READ UNCOMMITED, which is not supported by Oracle. Such type of read is known as a DIRTY READ.

Many database scholars argue that a dirty read should never be allowed, under any circumstances, which I tend to agree with. And Oracle seems to agree as well, since it does not support this by design, unlike other databases.

So, the idea of Oracle allowing such thing sounds crazy, right? Or maybe a bug?

Well, after some research this friend did, he found this post from Jonathan Lewis explaining a very rare but possible situation when these DIRTY READS could take place in Oracle and cause data confusion.

And I was able to reproduce the issue in several different versions, including 23c FREE.

In this post I will explain in details how to reproduce the issue, and then I will present the solution that will make the title of this post make sense.

Basically, the problem happens when the LGWR process hangs, avoiding the COMMIT to complete successfully. But the problem is the way Oracle works by default, the COMMIT steps are executed first in memory by writing the redo entries to the Redo Log Buffers and then calling LGWR to write them to Redo Log Files on disk. In the rare case when the LGWR is hung for whatever reason but the instance is still working, another session may end up querying and seeing the changed data event without the COMMIT being persisted to disk.

In order to reproduce the behavior, we will follow these steps exactly the way JL shows:

Initial Preparation

To prepare I will just create a table and insert a row of data:

create table t1(n1 number);

Table created.

insert into t1 values(1);

1 row created.

commit;

Commit complete.

Step 1 – Session 1 changes some data

Now let’s change some data:

col con_name for a10
col sid for a10
select SYS_CONTEXT ('userenv','con_name') con_name, SYS_CONTEXT ('userenv','sid') sid from dual;

CON_NAME   SID
---------- ----------
FREEPDB1   51

update t1 set n1 = 2;

1 row updated.

select * from t1;

	    N1
----------
	     2

Step 2 – Session 2 connects (or is already connected)

This is the session that will see the dirty read. It needs to be connected before the LGWR fails, because after that no new session will be able to connect.

col con_name for a10
col sid for a10
select SYS_CONTEXT ('userenv','con_name') con_name, SYS_CONTEXT ('userenv','sid') sid from dual;

CON_NAME   SID
---------- ----------
FREEPDB1   271

Step 3 – LGWR hangs

Let’s find the LGWR PID# and use it with oradebug to force a hang (put the process in a suspended state for the tests).

In order to use oradebug, I will need a third session connected as SYSDBA at the CDB level:

col con_name for a10
col sid for a10
select SYS_CONTEXT ('userenv','con_name') con_name, SYS_CONTEXT ('userenv','sid') sid from dual;

CON_NAME   SID
---------- ----------
CDB$ROOT   237

select * from session_privs where privilege = 'SYSDBA';

PRIVILEGE
----------------------------------------
SYSDBA

Then, I will identify the LGWR PID:

select pid from v$process where pname='LGWR';

       PID
----------
	    22

And finally I will put the process to sleep:

oradebug setorapid 22
Oracle pid: 22, Unix process pid: 88, NID: 4026532473, image: oracle@bcadfe8ca782 (LGWR)
oradebug suspend
Statement processed.

I won’t show it here, but you can test yourself that from this moment on, if you try to open a new session it will hang.

Step 4 – Session 1 issues a COMMIT

When the COMMIT is issued, first the server process attending that session will work in memory writing the COMMIT redo entry, and then calls LGWR to write the redo entries from the Redo Log Buffer into the Redo Log File on disk.

select SYS_CONTEXT ('userenv','con_name') con_name, SYS_CONTEXT ('userenv','sid') sid from dual;SQL> SQL> 

CON_NAME   SID
---------- ----------
FREEPDB1   51

commit;
-- THE SESSION WILL HANG

Since the LGWR is hung, the COMMIT does not finish and the session also hangs. BUT, the work in memory is already done and so from the memory perspective the COMMIT was successful already.

Step 5 – Session 2 issues a SELECT against the data and receives a DIRTY READ in response

SQL> select SYS_CONTEXT ('userenv','con_name') con_name, SYS_CONTEXT ('userenv','sid') sid from dual;

CON_NAME   SID
---------- ----------
FREEPDB1   271

SQL> select * from t1;

        N1
----------
         2

    See that? Even with the COMMIT not confirmed and the redo data not persisted on disk, the Session 2 was able to see the data already modified, which should NOT be allowed.

    So, this is a VERY VERY rare situation that only happened because a background process (the LGWR) stopped working properly, and right after, without the instance failing, a session changes data and another one checks that data. But although it’s rare, it can happen as we demonstrated here.

    Simulating an instance failure

    What happens now if the instance fails? Well, since the COMMIT was never persisted on disk, the transaction should be rolled back after the instance is back up, so theoretically the data change never happened.

    Let’s see it in action: in the SYSDBA session, without resuming the LGWR, I will force a restart of the instance:

    startup force
    ORACLE instance started.
    
    Total System Global Area 1603679416 bytes
    Fixed Size		    5313720 bytes
    Variable Size		  973078528 bytes
    Database Buffers	  620756992 bytes
    Redo Buffers		    4530176 bytes
    Database mounted.
    Database opened.
    

    Now that the instance is up again, I will reconnect as a normal user and check the data:

    col con_name for a10
    col sid for a10
    select SYS_CONTEXT ('userenv','con_name') con_name, SYS_CONTEXT ('userenv','sid') sid from dual;
    
    CON_NAME   SID
    ---------- ----------
    FREEPDB1   33
    
    select * from t1;
    
            N1
    ----------
             1
    

    As expected, the transaction was lost and the original value is back.

    Now, the solution

    So, as I mentioned in the beginning, I was able to reproduce the same behavior in different Oracle versions: 12, 19 and 23.

    BUT, in 23c there is a new parameter called paranoid_concurrency_mode that controls this behavior. I don’t know exactly how this parameter works internally, since at this point I could not find any documentation about it.

    This original value is FALSE, and when it is changed to TRUE, then the demonstrated behavior showed here does not happen. In this case, the Session 2 also hangs when trying to issue a SELECT against the changed data.

    So, this is a solution for the problem, and also a very rare case when a SELECT can hang in Oracle.

    Some important notes here:

    • I was only able to make the parameter to work by changing it at the CDB level, and restarting the instance (it’s not online modifiable). If I changed it at the PDB level the problem persisted, which makes sense since the LGWR is a background process for the instance, so to change its behavior it’s expected to change the parameter at the CDB level.
    • I don’t know what are the disadvantages of changing this parameter to TRUE, what else it changes or even what is the performance penalty for the instance. Although it’s not a hidden parameter (it doesn’t start with an hyphen), since there is no documentation at this point, you should ask My Oracle Support about changing it.

    So that’s it for now.

    This is just a study case, and PLEASE do not test or do any change in Production database without proper testings and in this particular case, having the OK from MOS.

    I hope you like it.

    Se you in the next post!

    Testing Oracle 23c Lock-Free Reservations

    Hello,

    In this post I will practice test how the new 23c feature Lock-Free Reservations work.

    If you are not aware, here is a summary of what is Lock-Free Reservations:

    • It allows a session to update a specific column in a table row without locking the row.
    • The column must be defined with the new attribute RESERVABLE.
    • This is only valid for NUMERIC columns.
    • The UPDATE statement must change ONLY reservable columns, and filter the rows using the primary key.
    • The column value must be increased or decreased. You cannot specify a literal value.
    • The updated value after the COMMIT will be based on the value available at COMMIT time, not at transaction start time. The value could have been modified by other sessions after your transaction started, using lock-free reservation updates.
    • The proposed update is “promised” and reserved, but will only be effective at COMMIT time.
    • The pending updates are registered in a journal.

    So, lets test it in real world.

    Creating a table and inserting data

    First, I will create a sample table with two reservable columns, and insert some data. By the way, my INSERT statement is inserting 3 rows in the VALUES clause, another nice new feature in 23c called Table Value Constructor:

    create table t1 (
    id number primary key, 
    value number,
    res1 number reservable constraint ck_res1 check (res1 >= 0),
    res2 number reservable constraint ck_res2 check (res2 >= 0));
    
    Table created.
    
    insert into t1 values 
    (1, 0, 10, 10),
    (2, 0, 10, 10),
    (3, 0, 10, 10)
    ;
    
    3 rows created.
    
    commit;
    
    commit complete.

    Updates on reservable columns must increase or decrease the value

    Note below that the first update fails because I tried to put a specific value in the reservable column. The second one works because I used an increment:

    update t1 set res1 = 102 where id=1;
    update t1 set res1 = 102 where id=1
           *
    ERROR at line 1:
    ORA-55746: Reservable column update statement only supports + or - operations on a reservable column.
    
    update t1 set res1 = res1 + 1 where id=1;
    
    1 row updated.

    Updates cannot mix reservable and non-reservable columns

    Again, below the first update fails because I tried to update reservable and non-reservable columns at the same time. The second one works and shows that I can update multiple reservable columns at the same time:

    update t1 set value = 1, res1 = res1 + 1 where id=1;
    update t1 set value = 1, res1 = res1 + 1 where id=1
           *
    ERROR at line 1:
    ORA-55735: Reservable and non-reservable columns cannot be updated in the same statement.
    
    update t1 set res1 = res1 + 1, res2 = res2 + 1 where id=1;
    
    1 row updated.

    Updates on reservable columns are only effective at COMMIT time

    When you update a reservable column and it’s successful, you actually receive a promise that you will be able to make the update at COMMIT time. So you won’t see your update right after issuing it. It’s important to note that for application purposes:

    rollback;
    
    Rollback complete.
    
    select * from t1 where id=1;
    
            ID      VALUE       RES1       RES2
    ---------- ---------- ---------- ----------
             1          0         10         10
    
    1 row selected.
    
    update t1 set res1 = res1 + 1, res2 = res2 + 1 where id=1;
    
    1 row updated.
    
    select * from t1 where id=1;
    
            ID      VALUE       RES1       RES2
    ---------- ---------- ---------- ----------
             1          0         10         10
    
    commit;
    
    Commit complete.
    
    select * from t1 where id=1;
    
            ID      VALUE       RES1       RES2
    ---------- ---------- ---------- ----------
             1          0         11         11
    
    1 row selected.
    

    Updates on reservable columns must filter rows by Primary Key

    If I don’t mention the primary key in the WHERE clause, an error is raised:

    update t1 set res1 = res1 + 1;
    update t1 set res1 = res1 + 1
           *
    ERROR at line 1:
    ORA-55732: Reservable column update should specify all the primary key columns in the WHERE clause.
    
    update t1 set res1 = res1 + 1 where value=1;
    update t1 set res1 = res1 + 1 where value=1
           *
    ERROR at line 1:
    ORA-55732: Reservable column update should specify all the primary key columns in the WHERE clause.
    

    Updates on reservable columns cannot use other columns’ values, even if the mentioned column is also reservable

    And I cannot even mention the column itself, in an update that syntactically would do nothing 🙂 :

    update t1 set res1 = res2 + 1 where id=1;
    update t1 set res1 = res2 + 1 where id=1
           *
    ERROR at line 1:
    ORA-55747: The SET clause of a reservable update statement requires the amount to be added or subtracted from the same reservable column, "RES2".
    
    update t1 set res1 = res1 where id=1;
    update t1 set res1 = res1 where id=1
           *
    ERROR at line 1:
    ORA-55746: Reservable column update statement only supports + or - operations on a reservable column.

    The same transaction can update reservable and a non-reservable columns

    You cannot mix updates on reservable and non-reservable columns in the same statement, but you can in the same transaction.

    EDIT 04/25/2023: as opposed to what I mentioned here initially, if you update a non-reservable column, the updated row will be locked even for other transactions, even if they only try to update reservable columns. I explain this better here.

    In this case, the UPDATE on the non-reservable column will hold a lock as usual, and prevent other transactions from updating that row, even if only updating the reservable columns.

    Session 1:

    select userenv('sid');
    
    USERENV('SID')
    --------------
    301
    
    1 row selected.
    update t1 set res1=res1+1 where id=1;
    
    1 row updated.
    
    update t1 set value=1 where id=1;
    
    1 row updated.
    

    Session 2:

    select userenv('sid');
    
    USERENV('SID')
    --------------
    300
    
    1 row selected.
    update t1 set res1=res1+2 where id=1;
    
    1 row updated.
    
    update t1 set value=1 where id=1;
    
    (LOCKED...)
    

    Checking the journal for pending reservations

    When you create a table with reservable columns, Oracle creates an associated table to record the journal of pending updates on these columns. The name of the table is SYS_RESERVJRNL_<object_id>.
    Please note that each session can only see its own reservations, not all of them. I could not find a way to see all pending reservations from all sessions, nor could find anything related in the documentation.

    Session 1:

    select userenv('sid');
    
    USERENV('SID')
    --------------
    301
    
    1 row selected.
    select object_id from user_objects where object_name='T1';
    
     OBJECT_ID
    ----------
         78433
    
    1 row selected.
    
    select * from SYS_RESERVJRNL_78433;
    
    ORA_SAGA_ID$                     ORA_TXN_ID$      ORA_STATUS$  ORA_STMT_TYPE$           ID RES1_OP RES1_RESERVED RES2_OP RES2_RESERVED
    -------------------------------- ---------------- ------------ ---------------- ---------- ------- ------------- ------- -------------
                                     0800080003020000 ACTIVE       UPDATE                    1 +                   1
    
    1 row selected.
    
    commit;
    
    commit complete.

    Session 2:

    select userenv('sid');
    
    USERENV('SID')
    --------------
    300
    
    1 row selected.
    
    select * from SYS_RESERVJRNL_78433;
    
    ORA_SAGA_ID$                     ORA_TXN_ID$      ORA_STATUS$  ORA_STMT_TYPE$           ID RES1_OP RES1_RESERVED RES2_OP RES2_RESERVED
    -------------------------------- ---------------- ------------ ---------------- ---------- ------- ------------- ------- -------------
                                     0900110009020000 ACTIVE       UPDATE                    1 +                   2
    
    1 row selected.
    
    commit;
    
    commit complete.

    Note that each session sees its own transaction reservation (the TXN_IDs are different).

    The journal table acts like a temporary table, although it’s not:

    select temporary from dba_tables where table_name='SYS_RESERVJRNL_78433';
    
    T
    -
    N
    
    1 row selected.

    The constraints are validated at the statement time

    Since the updates reserve the amounts requested, the constraints are validated at the statement time and will raise an error if your update along with all the reservations together would violate the constraint.
    Note that in this case, the validation is still pessimistic: if some or all the reservations do not confirm (transactions rollback), your update could make through, but since it’s not guaranteed at that point, the constraint has to raise an error.

    Session 1:

    The first UPDATE receives an error because it alone would violate the constraint, since I’m trying to decreasing the value by 20, which would result in a negative value.

    The second one works since it’s decreasing the value by 10 and the resulting value would not violate the constraint.

    select userenv('sid');
    
    USERENV('SID')
    --------------
    301
    
    1 row selected.
    
    rollback;
    
    Rollback complete.
    
    select * from t1 where id=1;
    
            ID      VALUE       RES1       RES2
    ---------- ---------- ---------- ----------
             1          0         14         11
    
    1 row selected.
    
    update t1 set res1 = res1 - 20 where id=1;
    update t1 set res1 = res1 - 20 where id=1
    *
    ERROR at line 1:
    ORA-02290: check constraint (TEST.CK_RES1) violated
    
    update t1 set res1 = res1 - 10 where id=1;
    
    1 row updated.
    

    Session 2:

    Note that here, the same update that worked for Session 1 does not work because now the combined reservations would be a decrease of 20, again resulting in a negative number that is not valid for the constraint.

    select userenv('sid');
    
    USERENV('SID')
    --------------
    300
    
    1 row selected.
    
    rollback;
    
    Rollback complete.
    
    update t1 set res1 = res1 - 10 where id=1;
    update t1 set res1 = res1 - 10 where id=1
    *
    ERROR at line 1:
    ORA-02290: check constraint (TEST.CK_RES1) violated
    

    Triggers on reservable columns are triggered at COMMIT time

    A row-level trigger on a non-reservable column would always be triggered at the statement time, but this is not the case for reservable columns.
    Note that I will create two triggers, one on the column VALUE, that is not reservable, and another on RES1 which is reservable. I will create a log table to use in the triggers:

    create table t1_log_reservations 
    (id number, timestamp date, column_name varchar2(30), value number);
    
    Table created.
    
    create or replace TRIGGER trg_on_value
    after UPDATE of value ON t1 
    for each row
    BEGIN
    	insert into t1_log_reservations
    	values (:new.id, sysdate, 'VALUE', :new.value);
    END;
    /
    
    Trigger created.
    
    create or replace TRIGGER trg_on_res1
    after UPDATE of res1 ON t1 
    for each row
    BEGIN
    	insert into t1_log_reservations
    	values (:new.id, sysdate, 'RES1', :new.res1);
    END;
    /
    
    Trigger created.

    Now I will update the two columns and check my log table that is populated by the triggers:

    update t1 set res1=res1+1 where id=1;
    
    1 row updated.
    
    update t1 set value=10 where id=1;
    
    1 row updated.
    
    select * from t1_log_reservations;
    
            ID TIMESTAMP           COLUMN_NAME                         VALUE
    ---------- ------------------- ------------------------------ ----------
             1 2023-04-18 16:54:58 VALUE                                  10
    
    1 row selected.

    Note that only the trigger on VALUE was triggered so far.

    Now, let’s COMMIT and check again:

    commit;
    
    Commit complete.
    
    select * from t1_log_reservations;
    
            ID TIMESTAMP           COLUMN_NAME                         VALUE
    ---------- ------------------- ------------------------------ ----------
             1 2023-04-18 16:54:58 VALUE                                  10
             1 2023-04-18 16:57:06 RES1                                    2
    
    2 rows selected.

    Now the trigger on RES1 was triggered.

    You cannot drop a table with reservable columns

    If you try to drop a table with reservable columns you get an error. So, you first need to ALTER the columns to NOT RESERVABLE and the you can drop the table:

    drop table t1;
    drop table t1
               *
    ERROR at line 1:
    ORA-55764: Cannot DROP or MOVE tables with reservable columns. First run "ALTER TABLE  MODIFY ( NOT RESERVABLE)" and then DROP or MOVE the table.
    
    alter table t1 modify (res1 not reservable, res2 not reservable);
    
    Table altered.
    
    drop table t1;
    
    Table dropped.

    I’m pretty sure I may have missed some important points to address about this new, amazing feature of Oracle 23c.

    Let me know in the comments and I can include or create a supplemental post.

    I hope I hope it can be useful.

    See you soon!

    How to easily get the corresponding AWR Snapshots interval for an interval date

    Hello,

    This is another short script to help you translate a provided date interval into the corresponding AWR snapshots interval.

    I don’t know if you also struggle with this, but sometimes I have difficulties in selecting the exact begin and end SNAP_ID based on a specific date interval. It’s because sometimes all that BEGIN_INTERVAL_TIME and END_INTERVAL_TIME confuses me a little bit 🙂 .

    For example, if I want to get an AWR from yesterday 10 am until today 10 am, it’s not uncommon for me to select the initial snapshot as the one with BEGIN_INTERVAL_TIME at yesterday 10 am, that would have its END_INTERVAL_TIME at 11 am (assuming the default 1h snapshots interval). And then, when I extract the AWR, I realize its time window actually starts at 11 am instead of 10 am. This is because we need to use the SNAP_ID that ENDS at the starting point of our desired window.

    I know, I know, it’s confusing. And this is why I wrote this script, to simplify things and make it easy.

    This script just receives as parameters the BEGIN_DATE, END_DATE and the INST_ID of the instance. And then it returns the corresponding BEGIN_SNAP, END_SNAP, and also a flag showing is the database was restarted during the provided time window.

    If the database was restarted, you CANNOT extract an AWR for that interval.

    If there is no restart during the interval, then you can just extract your AWR by providing the outputted BEGIN and END_SNAP. Maybe using my provided script that will generate the AWR with a better file name 😉 .

    So, here is the script dates_to_snaps.sql:

    /*
    dates_to_snaps.sql
    This script shows the snapshot interval corresponding to a provided date/time interval, for a particular instance
    Created by Eduardo Claro
    */
    
    undef begin_time
    undef end_time
    undef inst_id
    
    col min_time for a30
    col max_time for a30
    col restarted for a10
    
    select min(SNAP_ID) begin_snap, max(SNAP_ID) end_snap, 
    	min(END_INTERVAL_TIME) min_time, max(END_INTERVAL_TIME) max_time,
    	case when count(distinct STARTUP_TIME) > 1 then 'YES' else 'NO' end RESTARTED
    from (
    	select
    		a.*, lead(in_the_interval) over (order by SNAP_ID) as next_in_the_interval
    	from (
    		select SNAP_ID, END_INTERVAL_TIME, STARTUP_TIME,
    			case when trunc(END_INTERVAL_TIME,'mi') > &&begin_time
    				  and trunc(BEGIN_INTERVAL_TIME,'mi') < &&end_time
    				then 1 else 0 end in_the_interval,
    			row_number() over (order by snap_id desc) rn
    		from dba_hist_snapshot s
    		join v$database d using (DBID)
    		where INSTANCE_NUMBER = nvl('&&inst_id','1')
    		order by SNAP_ID
    		) a
    	) b
    where in_the_interval = 1 or next_in_the_interval = 1;

    Please note that I am truncating the snapshot dates at the minutes, disregarding the seconds. This is because it takes some seconds for the snapshot to be generated. Then, if you have a new snapshot at the top of every hour, most likely your snapshot dates will be like ’07:00:23′ instead of the “ideal” ’07:00:00′.

    Another thing to note is that I am considering ANY snapshot that has at least a partial overlap with the provided time window. For example, if your time window is from 3:30 pm until 5:30 pm, and you have hourly snapshots, then the interval snapshots provided would be from 3 pm until 6 pm, thus covering your entire interval. In order to have this “expanded” window, I compare the END_INTERVAL_TIME with the provided begin time, and the BEGIN_INTERVAL_TIME with the provided end time. I know again, it sounds weird, but it works ;-).

    And here is a sample run:

    SQL> select sysdate from dual;
    
    SYSDATE
    -------------------
    2023-04-13 14:20:08
    
    1 row selected.
    
    Elapsed: 00:00:00.16
    SQL> @blog_posts/dates_to_snaps
    Enter value for begin_time: sysdate-1
    Enter value for end_time: sysdate
    Enter value for inst_id: 1
    
    BEGIN_SNAP   END_SNAP MIN_TIME                       MAX_TIME                       RESTARTED
    ---------- ---------- ------------------------------ ------------------------------ ----------
         57646      57742 2023-04-12 14:15:41.111        2023-04-13 14:15:19.739        NO
    
    1 row selected.

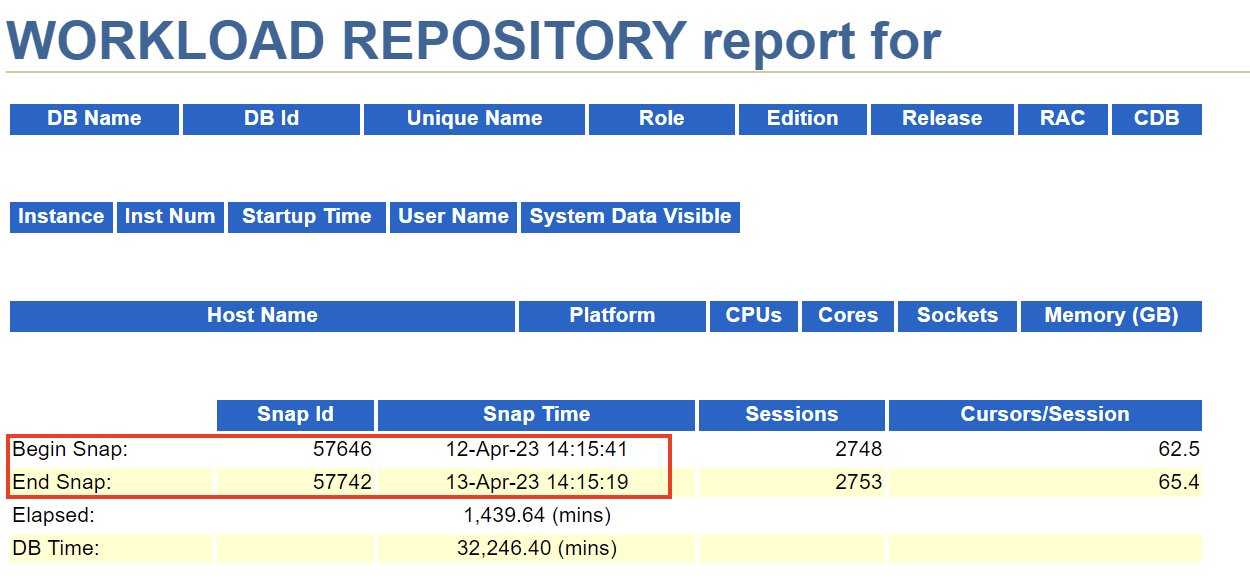
    In this example, I can run an AWR for the last 24 hours because there was no restart during the interval, and I would get it by providing the SNAP_IDs 57646 and 57742:

    Screenshot 2023-04-13 at 4.21.40 PM

    That’s it, I hope it can be useful.

    Let me know if you have any questions, I would be happy to answer.

    See you soon.

    How to have AWRs with a more meaningful file name

    Hello,

    This is a short and easy one.

    If you use AWR a lot, especially running the provided awrrpt.sql script, you probably have been in that situation when you create a lot of AWR reports, and right after (or days later) you end up not knowing which report is for which day, since the default name is just something like “awrrpt_1_235_236.html”, begin 235 the first snapshot and 236 the last one.

    So, here I present a very simple script that will automatically create AWRs with a better name, and you can also run it from a SQL Plus client instead of connecting to the server to run awrrpt.

    And that’s it, here is the script:

    /*
    This script generates AWR Reports with a user-friendly name
    Created by Eduardo Claro
    */
    
    undef begin_snap
    undef end_snap
    undef name
    undef inst_id
    
    SET VER OFF FEED OFF TIMING OFF ECHO OFF
    
    col AWRSPOOL NEW_VALUE AWRSPOOL head "Generating AWR report, please wait..."
    col DBID new_value DBID noprint
    col INS new_value INS noprint
    with snap as (
    	select
    		to_char(min(END_INTERVAL_TIME),'yyyy-mm-dd-hh24mi') min_snap,
    		to_char(max(END_INTERVAL_TIME),'yyyy-mm-dd-hh24mi') max_snap
    	from dba_hist_snapshot
    	where snap_id between '&&begin_snap' and '&&end_snap'
    )
    select 
    	DISTINCT DBID,
    	INSTANCE_NUMBER INS,
    	'c:\temp\' || 
    	'AWR_&&begin_snap.-&&end_snap._' || 
    	case when DATABASE_ROLE = 'PRIMARY' then DB_UNIQUE_NAME else PRIMARY_DB_UNIQUE_NAME end || 
    	'_' || nvl('&&inst_id',i.instance_number) || '_' || 
    	min_snap || '-' || max_snap || 
    	case when '&&name' is not null then '_&&name' end ||
    	'.html' as AWRSPOOL
    from v$database d, v$instance i, snap s
    ;
    
    prompt
    
    set HEAD OFF term off
    
    spool &awrspool
    
    --Regular AWR report
    select * from table(
    	DBMS_WORKLOAD_REPOSITORY.AWR_REPORT_HTML(
    	   l_dbid       =>    '&dbid',
    	   l_inst_num   =>    '&ins',
    	   l_bid        =>    '&begin_snap',
    	   l_eid        =>    '&end_snap'))
    ;
    
    spool off
    set term on
    
    prompt Report generated.
    

    And here is a sample run:

    SQL> @blog_posts/awr
    Enter value for begin_snap: 211
    Enter value for end_snap: 213
    Enter value for inst_id:
    Enter value for name:
    
    Generating AWR report, please wait...
    -----------------------------------------------------------------------------
    c:\temp\AWR_211-213_BLDTSAWS_1_2023-04-11-0000-2023-04-11-0200.html
    
    Report generated.

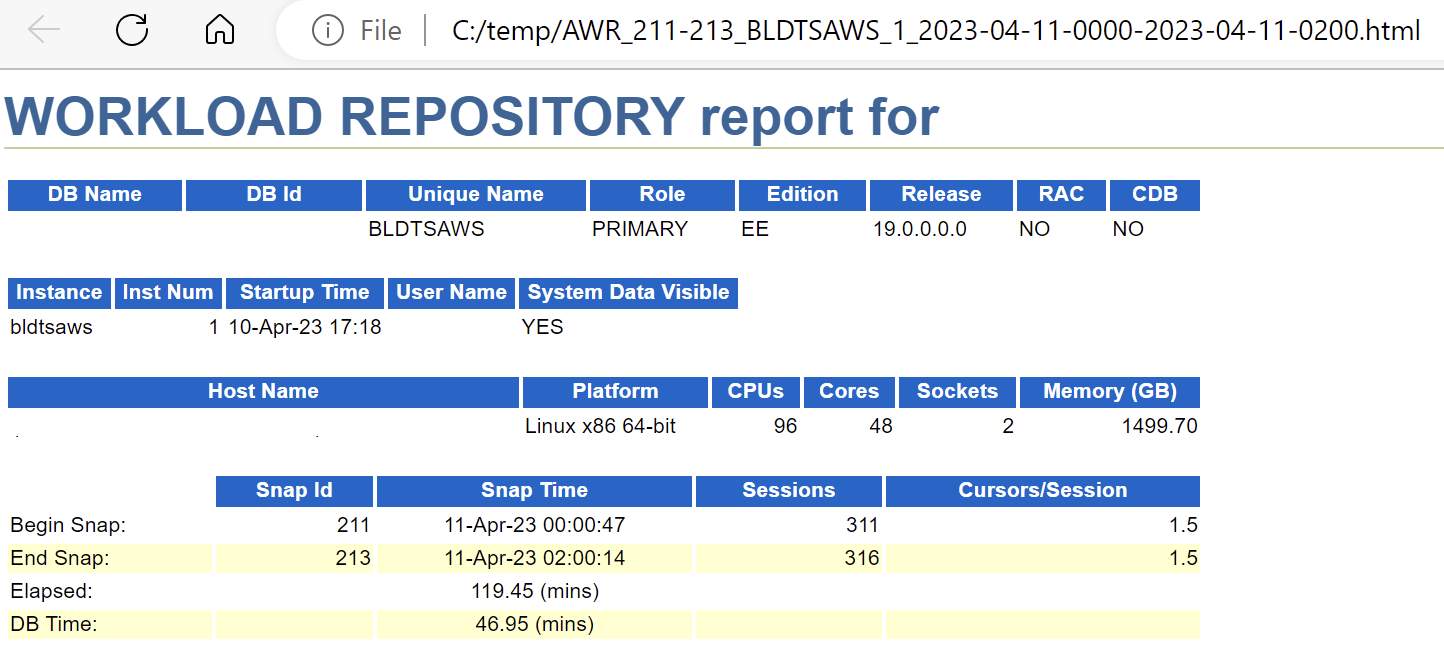
    The result? Just an AWR report as you already know, but with a file name that will let you know not only the begin and end snapshot, but also the DB name, instance, begin and end date/time:

    Screenshot 2023-04-12 at 5.17.40 PM

    If you want a RAC AWR report, just change the call from AWR_REPORT_HTML to AWR_GLOBAL_REPORT_HTML, the parameters are the same.

    That’s it, I hope it can be useful.

    Converting intervals of values into an IN-list for query filters

    Hello,

    As you may know if you have checked some of the scripts or queries I post here, I like to use parameters and variables in my scripts, to make them more flexible to show me the results I want in a variety of situations.

    Since I work with performance, I constantly have to query AWR and ASH views to check what happened in the database during a specific period. Most of these views have a DATE dimension that is usually the most frequent filter we used: in DBA_HIST_ACTIVE_SESSION_HISTORY for example, it’s SAMPLE_TIME. In DBA_HIST_SNAPSHOT it’s usually END_INTERVAL_TIME.

    So, usually when we want to query these views we have a period to analyze, and a date interval that is translated in a predicate like this:

    ...
    WHERE SAMPLE_TIME BETWEEN &START_DATE AND &END_DATE
    ...
    

    But sometimes (or many times), just filtering the begin and end dates and times is not enough. What if for example I want to analyze only what occurred between 8 am and 6 pm? Or, only on Mondays and Wednesdays?

    Then I would need to add more predicates to filter these specific days or hours. It’s relatively easy if you know the values. For example, I could include:

    ...
    WHERE SAMPLE_TIME BETWEEN &START_DATE AND &END_DATE
    AND EXTRACT(HOUR FROM SAMPLE_TIME) BETWEEN 8 AND 17
    ...

    (Please note that if I want to check hours from between 8 and 18 by extracting the hour piece of the date, then I should put my interval as 8 and 17, to actually accept times between 08:00:00 and 17:59:59).

    But I would like to receive this as a variable, and even more, I would like that my script would translate a complex set of intervals into an IN-list for then inject this into my main query as a filter.

    I talking about this: If I want to filter the hour intervals to be “from 5 until 6, from 8 until 12, from 13 until 18 and from 23 until 2 (of the next day)”, I would pass as a parameter “5,8-11,13-17,23-1” (note again I’m subtracting 1 from the end as explained above, to use the EXTRACT of the hour piece), and it would be translated into 5,8,9,10,11,13,14,15,16,17,23,0,1.

    So, here I present two versions of a simple script that does exactly it: the first translates a string with number intervals into a IN-list variable, and the second translate the intervals into a in-line view, both to be used in IN operators as I will show below.

    The scripts receive 3 parameters:

    • &1: the string to be converted
    • &2: the first value of the interval
    • &3: the last value of the interval

    In my example, I would pass “5,8-11,13-17,23-1” “0” “23”.

    Here is the first script, that returns an IN-LIST:

    
    col IN_LIST new_value IN_LIST
    WITH 
    a as (
    	select nvl('&1','&2-&3') intervals, to_number('&2') fv, to_number('&3') lv
    	from dual
    ),
    b as (
    	select level-1+fv val
    	from a
    	connect by level <= lv-fv+1
    ),
    c as (
    	select regexp_substr(intervals, '[^,]+', 1, level) col
    	from a
    	connect by level <= regexp_count(intervals, ',')+1
    ),
    d as (
    	select to_number(nvl(substr(col,1,instr(col,'-')-1),col)) minval, to_number(nvl(substr(col,instr(col,'-')+1,100),col)) maxval
    	from c
    ),
    e as (
    	select minval, maxval
    	from d, a
    	where maxval >= minval
    	UNION ALL
    	select minval, lv
    	from d, a
    	where maxval < minval
    	UNION ALL
    	select fv, maxval
    	from d, a
    	where maxval < minval
    ),
    intervals_to_IN as (
        select listagg(val,',') within group (order by val) IN_LIST
        from (
    	select DISTINCT val
    	from a, b, e
    	where val between nvl(minval,fv) and nvl(maxval,lv)
    	and val >= fv
    	and maxval >= minval
    	)
    )
    select * from intervals_to_IN
    ;
    
    IN_LIST
    ------------------------------------------
    0,1,5,8,9,10,11,13,14,15,16,17,23
    
    1 row selected.

    Then you could use it in your main query, like this:

    select distinct EXTRACT(HOUR FROM SAMPLE_TIME)
    from DBA_HIST_ACTIVE_SESS_HISTORY
    where SAMPLE_TIME BETWEEN &START_DATE AND &END_DATE
    and EXTRACT(HOUR FROM SAMPLE_TIME) IN (&IN_LIST)
    order by 1;
    
    (EXTRACT(HOURFROMSAMPLE_TIME))
    ------------------------------
                                 0
                                 1
                                 5
                                 8
                                 9
                                10
                                11
                                13
                                14
                                15
                                16
                                17
                                23
    
    13 rows selected.

    And here is the second script, with just a slight change to return a IN-line view to be joined in the main query:

    WITH 
    a as (
    	select nvl('&1','&2-&3') intervals, to_number('&2') fv, to_number('&3') lv
    	from dual
    ),
    b as (
    	select level-1+fv val
    	from a
    	connect by level <= lv-fv+1
    ),
    c as (
    	select regexp_substr(intervals, '[^,]+', 1, level) col
    	from a
    	connect by level <= regexp_count(intervals, ',')+1
    ),
    d as (
    	select to_number(nvl(substr(col,1,instr(col,'-')-1),col)) minval, to_number(nvl(substr(col,instr(col,'-')+1,100),col)) maxval
    	from c
    ),
    e as (
    	select minval, maxval
    	from d, a
    	where maxval >= minval
    	UNION ALL
    	select minval, lv
    	from d, a
    	where maxval < minval
    	UNION ALL
    	select fv, maxval
    	from d, a
    	where maxval < minval
    ),
    hours as (
    	select DISTINCT val as hour
    	from a, b, e
    	where val between nvl(minval,fv) and nvl(maxval,lv)
    	and val >= fv
    	and maxval >= minval
    )
    select /*+ NO_MERGE */ 
    distinct EXTRACT(HOUR FROM SAMPLE_TIME)
    from DBA_HIST_ACTIVE_SESS_HISTORY a
    where SAMPLE_TIME between SYSDATE-1 and SYSDATE
    and EXTRACT(HOUR FROM a.SAMPLE_TIME) in (select hour from hours)
    order by 1
    ;
    
    EXTRACT(HOURFROMSAMPLE_TIME)
    ----------------------------
                               0
                               1
                               5
                               8
                               9
                              10
                              11
                              13
                              14
                              15
                              16
                              17
                              23
    
    13 rows selected.

    (Note I used the NO_MERGE hint for performance purposes, to request the main query to be resolved first, before the inner query).

    That’s it, I hope it can be useful.

    I use this type of filter all the time to get the results filtered the way I want in my scripts.

    Let me know if you have any comments.

    Not only DETERMINISTIC: How a PL/SQL function call in your SQL can impact performance

    Hello,

    You may have already read something about how a PL/SQL function call from a SQL query can impact performance in many ways:

    There is what is called context switch (the PL/SQL interpreter must be called every time the function is executed, then the control returns to the SQL engine, and so on).

    There is also possible issues with Read consistency as I explained here.

    Depending on how many times the function executes, it can directly impact performance, and you can address it if your function is deterministic (i.e., if it always return the same result for the same input parameters) as explained here.

    But I’m here to talk about another way a PL/SQL function can impact the performance of your SQL queries: by changing the execution plan.

    Let me explain with a real example that I’ve found (again) this week in an application I support:

    The application uses a fake date of 9999/12/31 as something meaningful in many tables and columns. For sure there should be better ways of doing that, for example simply leaving the date as NULL and then treating it on the application side, or maybe something else depending on the case, but it is what it is.

    So, instead of hard coding the date in the application, they’ve created a PL/SQL function called HIGH_DATE that simply returns this date. And this function is called in many queries, some very complex and it is used in predicates as well.

    Yes, the function is created as deterministic. So, the issue here is not related to the number of executions of the function, but that Oracle DOES NOT analyze the possible results of the function in execution time.

    When we read the function, it is clear that no matter what, the result is always gonna be 9999/12/31. But it’s not clear for Oracle at execution time.

    So, when you do this, Oracle will come up with an estimation that is simply the average number of rows for each date in your table.

    But, since this fake date is meaningful for the application, the number of rows with that particular date is much higher, which ends up causing a failing estimate that can lead to a non-optimal execution plan.

    Let me explain with a practical example:

    First of all, let’s create the function:

    CREATE OR REPLACE EDITIONABLE FUNCTION HIGH_DATE
    return date DETERMINISTIC
    is
    begin
    return TO_DATE('31-Dec-9999');
    end;
    /
    
    Function created.

    Then, I’ll create my sample table with some data, create an index and gather stats:

    create table my_table as
    select level id, 
    	case when level <= 500 then to_date('2020/01/01','yyyy/mm/dd')+level-1 else to_date('9999/12/31','yyyy/mm/dd') end my_date,
    	lpad('X',1000,'X') nothing
    from dual connect by level <= 100000;
    
    Table created.
    
    commit;
    
    Commit complete.
    
    create index my_table_i1 on my_table (my_date);
    
    Index created.
    
    exec dbms_stats.gather_table_stats(user,'MY_TABLE',METHOD_OPT=>'for all indexed columns size auto')
    
    PL/SQL procedure successfully completed.
    

    Note that I intentionally created the a skewed distribution of dates, with 99.5k rows out of 100k with our fake meaningful date, and the other 500 rows each with a different date. I also forced a creation of a histogram for the optimizer to be aware of the skewed data.

    So, as expected, if I filter the table by MY_DATE the optimizer will choose to use the index or not depending on the value filtered:

    set autot trace exp
    
    select * from my_table where my_date = to_date('2020/07/01','yyyy/mm/dd');
    
    Execution Plan
    ----------------------------------------------------------
    Plan hash value: 509748959
    
    ---------------------------------------------------------------------------------------------------
    | Id  | Operation                           | Name        | Rows  | Bytes | Cost (%CPU)| Time     |
    ---------------------------------------------------------------------------------------------------
    |   0 | SELECT STATEMENT                    |             |     1 |  1014 |     2   (0)| 00:00:01 |
    |   1 |  TABLE ACCESS BY INDEX ROWID BATCHED| MY_TABLE    |     1 |  1014 |     2   (0)| 00:00:01 |
    |*  2 |   INDEX RANGE SCAN                  | MY_TABLE_I1 |     1 |       |     1   (0)| 00:00:01 |
    ---------------------------------------------------------------------------------------------------
    
    Predicate Information (identified by operation id):
    ---------------------------------------------------
    
       2 - access("MY_DATE"=TO_DATE(' 2020-07-01 00:00:00', 'syyyy-mm-dd hh24:mi:ss'))
    
    select * from my_table where my_date = to_date('9999/12/31','yyyy/mm/dd');
    
    Execution Plan
    ----------------------------------------------------------
    Plan hash value: 3804444429
    
    ------------------------------------------------------------------------------
    | Id  | Operation         | Name     | Rows  | Bytes | Cost (%CPU)| Time     |
    ------------------------------------------------------------------------------
    |   0 | SELECT STATEMENT  |          | 99500 |    96M|   177   (3)| 00:00:01 |
    |*  1 |  TABLE ACCESS FULL| MY_TABLE | 99500 |    96M|   177   (3)| 00:00:01 |
    ------------------------------------------------------------------------------
    
    Predicate Information (identified by operation id):
    ---------------------------------------------------
    
       1 - filter("MY_DATE"=TO_DATE(' 9999-12-31 00:00:00', 'syyyy-mm-dd hh24:mi:ss'))

    Note the Optimizer estimated correctly 1 row and 99.5K rows respectively, and so it was able to choose to go via index in the first case, but via full table scan in the second.

    So far, so good.

    Let’s see what the Optimizer shows if we issue the query with a bind variable instead:

    var a varchar2(200)
    select * from my_table where my_date = :a;
    
    Execution Plan
    ----------------------------------------------------------
    Plan hash value: 509748959
    
    ---------------------------------------------------------------------------------------------------
    | Id  | Operation                           | Name        | Rows  | Bytes | Cost (%CPU)| Time     |
    ---------------------------------------------------------------------------------------------------
    |   0 | SELECT STATEMENT                    |             |   200 |   198K|    30   (0)| 00:00:01 |
    |   1 |  TABLE ACCESS BY INDEX ROWID BATCHED| MY_TABLE    |   200 |   198K|    30   (0)| 00:00:01 |
    |*  2 |   INDEX RANGE SCAN                  | MY_TABLE_I1 |   200 |       |     1   (0)| 00:00:01 |
    ---------------------------------------------------------------------------------------------------
    
    Predicate Information (identified by operation id):
    ---------------------------------------------------
    
       2 - access("MY_DATE"=:A)

    Now, as the Optimizer does not know what values is gonna be provided, the estimation was 200 rows, which is 100k rows / 501 distinct vales.

    Again, no news here, everything OK.

    But, let’s see what happens when we replace the value with a call to our PL/SQL function:

    var a varchar2(200)
    select * from my_table where my_date = HIGH_DATE;
    
    Execution Plan
    ----------------------------------------------------------
    Plan hash value: 509748959
    
    ---------------------------------------------------------------------------------------------------
    | Id  | Operation                           | Name        | Rows  | Bytes | Cost (%CPU)| Time     |
    ---------------------------------------------------------------------------------------------------
    |   0 | SELECT STATEMENT                    |             |   200 |   198K|    30   (0)| 00:00:01 |
    |   1 |  TABLE ACCESS BY INDEX ROWID BATCHED| MY_TABLE    |   200 |   198K|    30   (0)| 00:00:01 |
    |*  2 |   INDEX RANGE SCAN                  | MY_TABLE_I1 |   200 |       |     1   (0)| 00:00:01 |
    ---------------------------------------------------------------------------------------------------
    
    Predicate Information (identified by operation id):
    ---------------------------------------------------
    
       2 - access("MY_DATE"="HIGH_DATE"())

    Note, the Optimizer treated the function call as a non-predictable value, even when we know the value is always the same. Again, the Optimizer does not execute the function nor look into it to determine if the same value will always come.

    So, from the Optimizer perspective the result is unknown and then the estimation was simply the average 200 rows, just like when we used a bind variable.

    And, as a consequence, the Optimizer chose to read the table through the index, which clearly is not the best for this particular value. Compare the execution times:

    set autot off timing on feed only
    select * from my_table where my_date = high_date;
    
    99500 rows selected.
    
    Elapsed: 00:00:49.65
    
    select * from my_table where my_date = to_date('9999/12/31','yyyy/mm/dd');
    
    99500 rows selected.
    
    Elapsed: 00:00:39.02
    

    In the first query above, Oracle incorrectly picked the index and ended up taking almost 50s to return the rows. In the second query, it chose to go directly to the table and returned the same rows in 39s.

    Conclusion: be aware of the possible performance implications of using PL/SQL code in your SQL. Not only because of the number of executions of the function, that depending in the case would need to be executed once for each row, but also because of possible misestimations that could lead to bad execution plans.

    That’s it, I hope it can be useful.

    Let me know if you have any comment.

    How to effectively filter a LIKE predicate with a leading wildcard

    Hello,

    Last week I’ve found query with a performance issue that caused a lot of problems for the client, losing SLAs and the like.

    The problem occurred because the query execution plan changed suddenly due to something known as bind peeking. You can search on this subject and will find a lot of good content on that, but this is not the subject of this post.

    Instead of just wondering why the plan changed and Oracle picked a “bad” one for that particular moment, I analyzed the SQL itself to see what could be wrong with the writing, of course after also checking statistics, histograms and all other relevant information.

    The query is a join of several tables, and one of its most important predicates are the following, both on the same table:

    WHERE ... DOB=TO_DATE(:1, 'yyyy-mm-dd') and SSN like ':2'

    DOB is the date of birth, and the SSN is the Social Security Number which is always searched in that query as this: ‘%1234’.

    So, the query is searching a person by its date of birth plus the 4 last digits of the SSN. Pretty common, isn’t it?

    There was an index in place on the DOB alone, that was used most of the time, but sometimes depending on the value passed as date of birth along with other variables, Oracle was choosing a different path as I said.

    Well, it’s hard for Oracle to estimate how many rows a LIKE ‘%xxx’ construct would bring, and it will have to scan all the SSNs for that particular DOB to find the matches.

    I tried to search a good solution on the Internet and could not find. Maybe I didn’t search enough, because I had to come up with a solution very fast because the problem was very critical. When that “bad” plan was taken, the query was taking about 30 minutes to run instead of less than 30 seconds.

    After doing some tests, I was able to provide the following solution that solved the problem like a charm: instead of using a regular index and searching for the 4 last digits of the SSN using a leading wildcard in the LIKE predicate, I created a index with the REVERSE function (please do not confuse it with a REVERSE INDEX, that I tried and did not work by the way).

    With the new index and the rewritten query, I was able not only to solve the problem of the changing execution plan, but also improve a lot the performance even when comparing to the “good” previous plan: the new query is now running in 9 centi seconds instead of 17.4 seconds on average. So almost 200 times faster, and reading much less data blocks as well.

    Here is a test case (PLEASE NOTE that this is a simplified version, with just one table, so it does not bring the same improvement as the real case I mentioned earlier, but it serves to explain the solution):

    First, let’s create the test table, insert some data, create the index on DOB and check the execution plan for the query:

    create table person (
    	id number primary key,
    	name varchar2(50),
    	dob date,
    	ssn varchar2(9)
    );
    
    Table created.
     
    insert into person
    select level, 'person ' || level,
    	TO_DATE('01/01/2000','DD/MM/YYYY') + trunc(level/5000),
    	'12345' || lpad(level,4,'0')
    from dual
    connect by level <= 1000000;
    
    1000000 rows created.
    
    commit;
     
    Commit complete.
    
    create index i_1 on person (dob);
    
    Index created.
    
    exec dbms_stats.gather_table_stats(user,'PERSON')
    
    PL/SQL procedure successfully completed.
    
    set autot on
    select *
    from person
    where DOB=TO_DATE('01/01/2000','DD/MM/YYYY') 
    and SSN like '%0002';
    
           ID NAME                                               DOB                 SSN
    --------- -------------------------------------------------- ------------------- ---------
            2 person 2                                           2000-01-01 00:00:00 123450002
    
    1 row selected.
    
    
    Execution Plan
    ----------------------------------------------------------
    Plan hash value: 2698402335
    
    ----------------------------------------------------------------------------------------------
    | Id  | Operation                           | Name   | Rows  | Bytes | Cost (%CPU)| Time     |
    ----------------------------------------------------------------------------------------------
    |   0 | SELECT STATEMENT                    |        |   249 |  9213 |    46   (0)| 00:00:01 |
    |*  1 |  TABLE ACCESS BY INDEX ROWID BATCHED| PERSON |   249 |  9213 |    46   (0)| 00:00:01 |
    |*  2 |   INDEX RANGE SCAN                  | I_1    |  4975 |       |    16   (0)| 00:00:01 |
    ----------------------------------------------------------------------------------------------
    
    Predicate Information (identified by operation id):
    ---------------------------------------------------
    
       1 - filter("SSN" LIKE '%0002' AND "SSN" IS NOT NULL)
       2 - access("DOB"=TO_DATE(' 2000-01-01 00:00:00', 'syyyy-mm-dd hh24:mi:ss'))
    
    
    Statistics
    ----------------------------------------------------------
             28  recursive calls
              0  db block gets
             84  consistent gets
              0  physical reads
              0  redo size
            436  bytes sent via SQL*Net to client
             38  bytes received via SQL*Net from client
              1  SQL*Net roundtrips to/from client
              6  sorts (memory)
              0  sorts (disk)
              1  rows processed
    

    Note that Oracle estimated the index I_1 would bring about 4975 rows that need to be further filtered to find the SSN matches. Also note the query read 84 blocks (consistent gets).

    Now, let’s see the new proposed index and the query altered to take advantage of it:

    create index i_2 on person (dob, reverse(ssn));
    
    Index created.
    
    exec dbms_stats.gather_index_stats(user,'I_2')
    
    PL/SQL procedure successfully completed.
    
    set autot on
    select *
    from person
    where DOB=TO_DATE('01/01/2000','DD/MM/YYYY') 
    and reverse(SSN) like reverse('%0002');
    
           ID NAME                                               DOB                 SSN
    --------- -------------------------------------------------- ------------------- ---------
            2 person 2                                           2000-01-01 00:00:00 123450002
    
    1 row selected.
    
    
    Execution Plan
    ----------------------------------------------------------
    Plan hash value: 407596358
    
    ----------------------------------------------------------------------------------------------
    | Id  | Operation                           | Name   | Rows  | Bytes | Cost (%CPU)| Time     |
    ----------------------------------------------------------------------------------------------
    |   0 | SELECT STATEMENT                    |        |   249 |  9213 |     5   (0)| 00:00:01 |
    |   1 |  TABLE ACCESS BY INDEX ROWID BATCHED| PERSON |   249 |  9213 |     5   (0)| 00:00:01 |
    |*  2 |   INDEX RANGE SCAN                  | I_2    |    45 |       |     3   (0)| 00:00:01 |
    ----------------------------------------------------------------------------------------------
    
    Predicate Information (identified by operation id):
    ---------------------------------------------------
    
       2 - access("DOB"=TO_DATE(' 2000-01-01 00:00:00', 'syyyy-mm-dd hh24:mi:ss') AND
                  REVERSE("SSN") LIKE '2000%')
           filter(REVERSE("SSN") LIKE '2000%')
    
    
    Statistics
    ----------------------------------------------------------
              1  recursive calls
              0  db block gets
              4  consistent gets
              0  physical reads
              0  redo size
            436  bytes sent via SQL*Net to client
             19  bytes received via SQL*Net from client
              1  SQL*Net roundtrips to/from client
              0  sorts (memory)
              0  sorts (disk)
              1  rows processed
    

    Note that now the new index I_2 is estimate to bring only 45 rows instead of 4975. The cost of the query also reduced from 46 to 5, and the number of consistent gets reduced from 84 to just 4. Also note that the estimation for the number of rows the query would return is still not accurate.

    That’s it, I hope it can be useful.

    EDIT (2022-SEP-15):

    1. Connor McDonald mentioned an important caveat (please see the comments area): the REVERSE function is “undocumented”, so it can change or disappear without notice anytime.
    2. As I suspected, there WAS already a blog post showing the same solution. Thanks Jeff Kemp!

    How to get the list of PARTITIONS or SUB PARTITIONS that would return rows from a query with some specific predicates

    Hello,

    Today I received the following request:

    I have a large fact table partitioned and sub partitioned and I want to get a list of the sub partitions that contain data based on a certain predicate that has nothing to do with any partition keys.

    Imagine we have a large sales table storing a row for each transaction processed and the table is partitioned by country and county and I need to retrieve a list of the sub partitions that have data re a limited set of products.

    You can use DBMS_ROWID to extract the RELATIVE_FNO and BLOCK_NUMBER for each row and then join the table with DBA_EXTENTS to find the extent the row resides, and then get its PARTITION_NAME (which by the way would be the sub partition if the table is sub-partitioned).

    So, here is the proposed solution with some sample data:

    EDIT 10/04/2022: the query initially provided was not considering the possibility of having the table in a bigfile tablespace, so it was not working for this particular cases. Now I included the second parameter in the DBMS_ROWID calls to provide the tablespace type, and also a join to DBA_TABLESPACE to support it.

    create table TEST_TABLE (id number primary key, county number not null, product_type number not null)
    partition by list (county) subpartition by hash(id) subpartitions 4
    (
    partition p1 values (1),
    partition p2 values (2),
    partition p3 values (3)
    )
    ;
     
    Table created.
     
    insert into TEST_TABLE
    select level, mod(level,3)+1, mod(level,2)+1
    from dual connect by level <= 10;
     
    10 rows created.
     
    commit;
     
    Commit complete.
     
    select
           a.*,
           e.PARTITION_NAME,
           e.SEGMENT_TYPE
    from TEST_TABLE a, dba_extents e, dba_tablespaces t
    where e.OWNER = 'CLAROE'
    and e.SEGMENT_NAME = 'TEST_TABLE'
    and E.RELATIVE_FNO = dbms_rowid.ROWID_RELATIVE_FNO(a.ROWID, decode(t.BIGFILE,'YES','BIGFILE','SMALLFILE'))
    and t.TABLESPACE_NAME = e.TABLESPACE_NAME
    and dbms_rowid.ROWID_BLOCK_NUMBER(a.ROWID, decode(t.BIGFILE,'YES','BIGFILE','SMALLFILE')) between BLOCK_ID and BLOCK_ID+BLOCKS-1
    --HERE YOU WOULD INCLUDE YOUR PREDICATES
    and product_type = 1;
     
           ID    COUNTY PRODUCT_TYPE PARTITION_NAME       SEGMENT_TYPE
    --------- --------- ------------ -------------------- ------------------
            6         1            1 SYS_SUBP110124       TABLE SUBPARTITION
           10         2            1 SYS_SUBP110129       TABLE SUBPARTITION
            4         2            1 SYS_SUBP110131       TABLE SUBPARTITION
            2         3            1 SYS_SUBP110134       TABLE SUBPARTITION
            8         3            1 SYS_SUBP110134       TABLE SUBPARTITION
      
    select
           DISTINCT
           e.PARTITION_NAME,
           e.SEGMENT_TYPE
    from TEST_TABLE a, dba_extents e, dba_tablespaces t
    where e.OWNER = 'CLAROE'
    and e.SEGMENT_NAME = 'TEST_TABLE'
    and E.RELATIVE_FNO = dbms_rowid.ROWID_RELATIVE_FNO(a.ROWID, decode(t.BIGFILE,'YES','BIGFILE','SMALLFILE'))
    and dbms_rowid.ROWID_BLOCK_NUMBER(a.ROWID, decode(t.BIGFILE,'YES','BIGFILE','SMALLFILE')) between BLOCK_ID and BLOCK_ID+BLOCKS-1
    --HERE YOU WOULD INCLUDE YOUR PREDICATES
    and product_type = 1;
     
    PARTITION_NAME       SEGMENT_TYPE
    -------------------- ------------------
    SYS_SUBP110134       TABLE SUBPARTITION
    SYS_SUBP110124       TABLE SUBPARTITION
    SYS_SUBP110129       TABLE SUBPARTITION
    SYS_SUBP110131       TABLE SUBPARTITION

    That’s it, I hope it can be useful.

    How to get the last REGISTERED use of SQL Profiles from memory, AWR and ASH all together

    Hello,

    I was assigned a task to determine the last time each existing SQL Profile were used, to disable and later on drop the unused ones.

    Of course, the easiest way to see the latest use is by checking GV$SQL.SQL_PROFILE. But, what if some profiles were used in the recent past but the SQL_IDs are not in memory anymore?

    Well, then we have basically two other sources to try to get this information:

    • AWR Repository, more specifically on DBA_HIST_SQLSTAT.SQL_PROFILE.
    • ASH Repository. This one is not so obvious, as I will explain below.

    In ASH we don’t have a SQL_PROFILE column, but we do have the SQL_ID. And in both GV$SQL_PLAN and DBA_HIST_SQLPLAN we have in OTHER_XML the information if that particular plan uses a SQL_PROFILE.

    We can see an example here (I’m just using a SUBSTR to show the part that matters:

    select substr(OTHER_XML, instr(OTHER_XML,'sql_profile') ,100) text
from DBA_HIST_SQL_PLAN p
where p.OTHER_XML is not NULL
and p.ID = 1
and SQL_ID='05h98cnugvfq4'
and PLAN_HASH_VALUE=933518975
/

TEXT
-------------------------------------------------------------------------------------------------------------
sql_profile" note="y"><![CDATA["coe_05h98cnugvfq4_403777895"]]></info><peeked_binds><bind nam=":1" p


    So, in order to determine if ASH captured a SQL_PROFILE being used, we would need to join the ASH views to the SQL Plan views and extract the information from OTHER_XML.

    By combining everything in one single query, we can determine when a SQL Profile was captured in each of the three sources: memory, AWR and ASH.

    BE CAUTIOUS: if the use of a particular SQL Profile was not captured in any of the sources (it will appear as NOT FOUND in my query’s results), it’s not 100% sure that it was not used. You can have a SQL_ID that uses a SQL Profile but:

    • is not in memory (it can have been aged out from Shared Pool).
    • was not captured by AWR (it was not among the top queries of any snapshot).
    • was not captured by ASH (it runs fast or it was simply not running during sample captures).

    Some important comments about the query:

    • I am uniting the results of both ASH views and also both SQL Plan views with UNION to cover all the possibilites.
    • I am searching everything available in the DBA_HIST views, so it can take some time to run. You can filter data by SNAP_ID or END_INTERVAL_TIME (joining with DBA_HIST_SNAPSHOT) to reduce the search time interval.
    • I am including in the results an example of a SQL_ID / PLAN_HASH_VALUE that used the SQL Profile, using a concatenation and MAX.
    • I am using the function EXTRACTVALUE to extract the relevant information from OTHER_XML.
    • The most important column is LAST_REGISTERED_USE, which is the latest date among the three possible MAX_TIME from each source.

    That being said, here is the query:

    col SQLID_PLAN for a30 head "SQL_ID / PLAN_HASH_VALUE"
col SQL_PROFILE for a30 wrap
col LAST_REGISTERED_USE for a20
col DESCRIPTION for a30 trunc
col CATEGORY for a20
col SIGNATURE for 99999999999999999999
--------------
WITH 
sqlstat as (
	select SQL_PROFILE,
		cast(max(END_INTERVAL_TIME) as date) max_time,
		MAX(SQL_ID || ' / ' || PLAN_HASH_VALUE) SQLID_PLAN
	from DBA_HIST_SQLSTAT s
	left join DBA_HIST_SNAPSHOT n using (SNAP_ID, DBID, INSTANCE_NUMBER)
	where SQL_PROFILE is not null
	group by SQL_PROFILE
),
gvsql as (
	select SQL_PROFILE,
		max(LAST_ACTIVE_TIME) max_time,
		MAX(SQL_ID || ' / ' || PLAN_HASH_VALUE) SQLID_PLAN
	from gv$SQL
	where SQL_PROFILE is not null
	group by SQL_PROFILE
),
sqlplan as (
	select
		DBID, SQL_ID, PLAN_HASH_VALUE, replace(extractvalue(xmlType(other_xml), '/*/info[@type = "sql_profile"]'),'"','') as SQL_PROFILE
	from DBA_HIST_SQL_PLAN p
	where p.OTHER_XML is not NULL
	and p.ID = 1
	and p.OTHER_XML like '%info type="sql_profile" note="y"%'
	UNION
	select
		DBID, SQL_ID, PLAN_HASH_VALUE, replace(extractvalue(xmlType(other_xml), '/*/info[@type = "sql_profile"]'),'"','') as SQL_PROFILE
	from GV$SQL_PLAN p
	cross join v$database d
	where p.OTHER_XML is not NULL
	and p.ID = 1
	and p.OTHER_XML like '%info type="sql_profile" note="y"%'
),
ash as (
	select SQL_PROFILE, max(max_time) as max_time, max(SQLID_PLAN) as SQLID_PLAN
	from
	(
		select 
			SQL_PROFILE, cast(max(SAMPLE_TIME) as date) max_time,
			MAX(SQL_ID || ' / ' || PLAN_HASH_VALUE) SQLID_PLAN
		from DBA_HIST_ACTIVE_SESS_HISTORY a 
		join sqlplan using (DBID, SQL_ID)
		group by SQL_PROFILE
		UNION
		select 
			SQL_PROFILE, cast(max(SAMPLE_TIME) as date) max_time,
			MAX(SQL_ID || ' / ' || PLAN_HASH_VALUE) SQLID_PLAN
		from GV$ACTIVE_SESSION_HISTORY a 
		cross join v$database d
		join sqlplan using (DBID, SQL_ID)
		group by SQL_PROFILE
	)
	group by SQL_PROFILE	
)
select p.NAME as SQL_PROFILE, p.CATEGORY, 
	case
		when coalesce(st.MAX_TIME, sq.MAX_TIME, ash.MAX_TIME ) is NULL then 'NOT FOUND'
		else to_char(greatest(nvl(st.MAX_TIME,sysdate-1000),nvl(sq.MAX_TIME,sysdate-1000),nvl(ash.MAX_TIME,sysdate-1000)),'yyyy-mm-dd hh24:mi')
	end LAST_REGISTERED_USE,
	coalesce(st.SQLID_PLAN, sq.SQLID_PLAN, ash.SQLID_PLAN ) SQLID_PLAN, 
	st.MAX_TIME SQLSTATS_MAX_TIME, sq.MAX_TIME GVSQL_MAX_TIME, ash.MAX_TIME ASH_MAX_TIME,
	cast(p.CREATED as date) as CREATED, cast(p.LAST_MODIFIED as date) as LAST_MOD, 
	p.DESCRIPTION, p.TYPE, p.STATUS, p.FORCE_MATCHING, p.SIGNATURE
from DBA_SQL_PROFILES p
left join sqlstat st on st.SQL_PROFILE = p.NAME
left join gvsql sq on sq.SQL_PROFILE = p.NAME
left join ash on ash.SQL_PROFILE = p.NAME
order by LAST_REGISTERED_USE
/


    And here is a sample result:

    SQL_PROFILE                    CATEGORY             LAST_REGISTERED_USE  SQL_ID / PLAN_HASH_VALUE       SQLSTATS_MAX_TIME   GVSQL_MAX_TIME      ASH_MAX_TIME        CREATED             LAST_MOD            DESCRIPTION                    TYPE    STATUS   FOR             SIGNATURE
------------------------------ -------------------- -------------------- ------------------------------ ------------------- ------------------- ------------------- ------------------- ------------------- ------------------------------ ------- -------- --- ---------------------
coe_8s3frh63f3y72_3488812378   DEFAULT              NOT FOUND                                                                                                       2021-12-02 16:19:27 2021-12-02 16:19:27 coe 8s3frh63f3y72 3488812378 1 MANUAL  ENABLED  YES   1465486117904564080
coe_cyudrfuvhh16a_2101168208   DEFAULT              NOT FOUND                                                                                                       2019-10-12 19:53:26 2019-10-12 19:53:26 coe cyudrfuvhh16a 2101168208 1 MANUAL  ENABLED  NO    1371566809470062529
coe_8f53cp5b3h7g1_1566927538   DEFAULT              NOT FOUND                                                                                                       2020-12-17 20:07:31 2020-12-17 20:07:31 coe 8f53cp5b3h7g1 1566927538 5 MANUAL  ENABLED  NO    5693890619594883870
coe_b8m5k5aru9zgs_3153591863   DEFAULT              2022-01-04 04:30     b8m5k5aru9zgs / 3153591863     2022-01-04 04:30:18                                         2021-11-05 03:38:11 2021-11-05 03:38:11 coe b8m5k5aru9zgs 3153591863 1 MANUAL  ENABLED  NO   15445241164961190877
coe_3khysk3nk5va4_2359245956   DEFAULT              2022-01-22 00:30     3khysk3nk5va4 / 2359245956     2022-01-22 00:30:03                                         2021-11-05 04:18:53 2021-11-05 04:18:53 coe 3khysk3nk5va4 2359245956 1 MANUAL  ENABLED  NO   17713775867979784296
coe_93dr759svpyy5_3962969280   DEFAULT              2022-01-24 00:00     93dr759svpyy5 / 3962969280     2022-01-24 00:00:20                     2022-01-23 23:48:34 2020-08-30 15:59:44 2020-08-30 15:59:44 coe 93dr759svpyy5 3962969280 1 MANUAL  ENABLED  YES  12038539845652393920
coe_8mn776u68bj8b_2063175662   DEFAULT              2022-01-24 00:00     8mn776u68bj8b / 2063175662     2022-01-24 00:00:20                     2022-01-23 23:48:24 2020-08-09 17:55:33 2020-08-09 17:55:33 coe 8mn776u68bj8b 2063175662 1 MANUAL  ENABLED  NO   16594446304563703766
coe_dy6vucw5jwnga_3774494613   DEFAULT              2022-03-14 23:03     dy6vucw5jwnga / 3774494613                         2022-03-14 23:03:15                     2018-03-20 03:15:16 2018-03-20 03:15:16 coe dy6vucw5jwnga 3774494613 1 MANUAL  ENABLED  YES  11143277849393767154
coe_dpm5bsc3yb6h3_4069454      DEFAULT              2022-03-14 23:12     dpm5bsc3yb6h3 / 4069454                            2022-03-14 23:12:15                     2022-02-18 01:05:14 2022-02-18 01:05:14 coe dpm5bsc3yb6h3 4069454 1860 MANUAL  ENABLED  YES  14276228312335389951
coe_2rhc99dcgzytb_2039548856   DEFAULT              2022-03-14 23:15     2rhc99dcgzytb / 2039548856     2022-03-14 23:15:42 2022-03-14 23:13:30                     2021-10-19 05:06:35 2021-10-19 05:06:35 coe 2rhc99dcgzytb 2039548856 1 MANUAL  ENABLED  NO   11119202897531861924
coe_c2ww73t55t9a4_1684296571   DEFAULT              2022-03-14 23:25     c2ww73t55t9a4 / 1684296571     2022-02-27 04:45:44 2022-03-14 23:25:44                     2021-09-30 01:42:37 2021-11-13 02:19:25 coe c2ww73t55t9a4 1684296571 1 MANUAL  ENABLED  YES  10398073236702436350


    So, based on the results, I can say that three of the SQL Profiles were not captured in use, so there is a good chance they are obsolete. I could then, with a lot of caution, try to disable then and, after some time, if there are no performance downgrades, drop them.

    That’s it, I hope you enjoy.

    As usual, let me know your thoughts.

    See you soon!

    How to infer the number of executions of a SQL_ID over a period of time from ASH based on SQL_EXEC_ID

    Hello,

    In this blog post Mr. Tanel Poder shows us the meaning of SQL_EXEC_ID. It’s worth reading.

    Basically, he shows that the SQL_EXEC_ID is a per INSTANCE / SQL_ID counter that starts with (INSTANCE_NUMBER * 2^24) and resets when:

    • It reaches the limit of 2^24.
    • The instance restarts.

    Please note that the counters don’t reset if you flush the shared_pool.

    So, SQL_EXEC_ID can track about 16.7 million executions of the same SQL_ID in the same instance before it resets.

    The proposition of this post is to show how you can take advantage of the SQL_EXEC_ID to infer the number of executions for a particular SQL_ID during a period of time, by querying ASH views. It may be important in a tuning analysis, because ASH does not capture all the executions, so with this you can have a new dimension of information showing you not only the number of executions that were capture by ASH for a particular SQL_ID, but also the TOTAL number of executions of the SQL_ID even if they were not captured.

    In the example below I am considering the DBA_ACTIVE_SESS_HISTORY view, but you could easily change it to use the GV$ACTIVE_SESSION_HISTORY view by just changing the table name, removing the join with DBA_HIST_SNAPSHOTS and the STARTUP_TIME in the partitioning clauses.

    In order to reproduce what I want, test all the cases accordingly and also allow you to do the same, my test query below creates fake ASH data with two in-line views to mimic DBA_HIST_ACTIVE_SESS_HISTORY and DBA_HIST_SNAPSHOT.

    My fake ASH has data for one particular SQL_ID with:

    • On instance 1 and BEFORE an instance STARTUP, 3 different SQL_EXEC_IDs, with the maximum being 1*power(2,24)+1100 and the minimum being 1*power(2,24)+1000.
    • On instance 1 and AFTER the STARTUP, 2 additional SQL_EXEC_IDs, with the maximum being 1*power(2,24)+220 and the minimum being 1*power(2,24)+50.
    • On instance 2 there was no STARTUP, 3 different SQL_EXEC_IDs, with the maximum being 2*power(2,24)+1100 and the minimum being 2*power(2,24)+800.

    The total executions of the SQL_ID during the period analyzed based on SQL_EXEC_ID is 101+171+301 = 573.

    The trick is done in two steps:

    • First, I use the analytical functions MAX and MIN partitioned by STARTUP_TIME, INSTANCE_NUMBER, SQL_ID to get the maximum and minimum SQL_EXEC_IDs of each group.
    • Then, I use the analytical function ROW_NUMBER to just consider the first row of each group in a aggregate SUM to provide the final result.

    So far, I could not find a more elegant way of doing this, let me know if you find any. But it’s working!

    Here is the query:

    WITH

    myash as (
	
    	--first captured execution
	
    	select 1 SNAP_ID, '10rma6qc4yjjd' SQL_ID, 1*power(2,24)+1000 SQL_EXEC_ID, 1 INSTANCE_NUMBER from dual UNION ALL 
	
    	--second captured execution
	
    	select 2 SNAP_ID, '10rma6qc4yjjd' SQL_ID, 1*power(2,24)+1050 SQL_EXEC_ID, 1 INSTANCE_NUMBER from dual UNION ALL 
	
    	--third captured execution
	
    	select 2 SNAP_ID, '10rma6qc4yjjd' SQL_ID, 1*power(2,24)+1055 SQL_EXEC_ID, 1 INSTANCE_NUMBER from dual 
    	UNION ALL 
	
    	--second captured execution still running
	
    	select 3 SNAP_ID, '10rma6qc4yjjd' SQL_ID, 1*power(2,24)+1050 SQL_EXEC_ID, 1 INSTANCE_NUMBER from dual UNION ALL 
	
    	--fourth captured execution still running. Total 101 execs
	
    	select 3 SNAP_ID, '10rma6qc4yjjd' SQL_ID, 1*power(2,24)+1100 SQL_EXEC_ID, 1 INSTANCE_NUMBER from dual UNION ALL 
	
    	--first captured execution after new startup
	
    	select 4 SNAP_ID, '10rma6qc4yjjd' SQL_ID, 1*power(2,24)+  50 SQL_EXEC_ID, 1 INSTANCE_NUMBER from dual UNION ALL 
	
    	--second captured execution after new startup
	
    	select 5 SNAP_ID, '10rma6qc4yjjd' SQL_ID, 1*power(2,24)+ 120 SQL_EXEC_ID, 1 INSTANCE_NUMBER from dual UNION ALL 
	
    	--third captured execution after new startup. Total 171 execs
	
    	select 6 SNAP_ID, '10rma6qc4yjjd' SQL_ID, 1*power(2,24)+ 220 SQL_EXEC_ID, 1 INSTANCE_NUMBER from dual UNION ALL 
	
    	--
	
    	--first captured execution on instance 2
	
    	select 1 SNAP_ID, '10rma6qc4yjjd' SQL_ID, 2*power(2,24)+ 800 SQL_EXEC_ID, 2 INSTANCE_NUMBER from dual UNION ALL 
	
    	--second captured execution on instance 2
	
    	select 3 SNAP_ID, '10rma6qc4yjjd' SQL_ID, 2*power(2,24)+ 900 SQL_EXEC_ID, 2 INSTANCE_NUMBER from dual UNION ALL 
	
    	--third captured execution on instance 2. Total 301 execs
	
    	select 6 SNAP_ID, '10rma6qc4yjjd' SQL_ID, 2*power(2,24)+1100 SQL_EXEC_ID, 2 INSTANCE_NUMBER from dual           

    ),
    
mysnaps as (
	
    	select 1 SNAP_ID, 1 INSTANCE_NUMBER, sysdate - 1 STARTUP_TIME from dual UNION ALL
	
    	select 2 SNAP_ID, 1 INSTANCE_NUMBER, sysdate - 1 STARTUP_TIME from dual UNION ALL
	
    	select 3 SNAP_ID, 1 INSTANCE_NUMBER, sysdate - 1 STARTUP_TIME from dual UNION ALL
	
    	select 4 SNAP_ID, 1 INSTANCE_NUMBER, sysdate     STARTUP_TIME from dual UNION ALL
	
    	select 5 SNAP_ID, 1 INSTANCE_NUMBER, sysdate     STARTUP_TIME from dual UNION ALL
	
    	select 6 SNAP_ID, 1 INSTANCE_NUMBER, sysdate     STARTUP_TIME from dual UNION ALL
	
    	--
	
    	select 1 SNAP_ID, 2 INSTANCE_NUMBER, sysdate - 1 STARTUP_TIME from dual UNION ALL
	
    	select 2 SNAP_ID, 2 INSTANCE_NUMBER, sysdate - 1 STARTUP_TIME from dual UNION ALL
	
    	select 3 SNAP_ID, 2 INSTANCE_NUMBER, sysdate - 1 STARTUP_TIME from dual UNION ALL
	
    	select 4 SNAP_ID, 2 INSTANCE_NUMBER, sysdate - 1 STARTUP_TIME from dual UNION ALL
	
    	select 5 SNAP_ID, 2 INSTANCE_NUMBER, sysdate - 1 STARTUP_TIME from dual UNION ALL
	
    	select 6 SNAP_ID, 2 INSTANCE_NUMBER, sysdate - 1 STARTUP_TIME from dual
    
),

    step1 as (
	
    	select
		
    		SQL_ID, INSTANCE_NUMBER, SQL_EXEC_ID, SNAP_ID, STARTUP_TIME,
		
    		1 + max(SQL_EXEC_ID) over (partition by STARTUP_TIME, INSTANCE_NUMBER, SQL_ID) - min(SQL_EXEC_ID) over (partition by STARTUP_TIME, INSTANCE_NUMBER, SQL_ID) EXECS,
		
    		row_number() over (partition by STARTUP_TIME, INSTANCE_NUMBER, SQL_ID order by INSTANCE_NUMBER, SQL_ID) RN_EXEC
	
    	from 
		
    		myash --DBA_HIST_ACTIVE_SESS_HISTORY
		
    		join mysnaps --DBA_HIST_SNAPSHOT
		
    			using (SNAP_ID, INSTANCE_NUMBER)
    

    )
    
select SQL_ID, 
	
    count(distinct SQL_EXEC_ID) CAPTURE_EXECS,
	
    sum(case when RN_EXEC=1 then EXECS else 0 end) as TOTAL_EXECS

    from step1

    GROUP BY SQL_ID
;

    Here is my fake ASH data (SELECT * FROM STEP1):

    SQL_ID        INSTANCE_NUMBER SQL_EXEC_ID   SNAP_ID STARTUP_TIME           EXECS   RN_EXEC

    ------------- --------------- ----------- --------- ------------------- -------- ---------

    10rma6qc4yjjd               1    16778271         2 2022-03-01 14:38:47      101         1
    
10rma6qc4yjjd               1    16778266         3 2022-03-01 14:38:47      101         2

    10rma6qc4yjjd               1    16778316         3 2022-03-01 14:38:47      101         3

    10rma6qc4yjjd               1    16778216         1 2022-03-01 14:38:47      101         4

    10rma6qc4yjjd               1    16778266         2 2022-03-01 14:38:47      101         5
    
10rma6qc4yjjd               2    33555332         3 2022-03-01 14:38:47      301         1
    
10rma6qc4yjjd               2    33555232         1 2022-03-01 14:38:47      301         2
    
10rma6qc4yjjd               2    33555532         6 2022-03-01 14:38:47      301         3

    10rma6qc4yjjd               1    16777436         6 2022-03-02 14:38:47      171         1
    
10rma6qc4yjjd               1    16777336         5 2022-03-02 14:38:47      171         2
    
10rma6qc4yjjd               1    16777266         4 2022-03-02 14:38:47      171         3

    And here is the result of the query:

    SQL_ID        CAPTURE_EXECS TOTAL_EXECS

    ------------- ------------- -----------
    
10rma6qc4yjjd            10         573

    So, as you can see, now you can not only get the number of CAPTURED executions (10),  but also the TOTAL number of executions (573).

    I hope this can help.

    I have a crazy 🙂 script to query data from ASH, with a million options just like others I have already posted. I will post this one here soon.

    Enjoy!

    See you.