Tag Archives: Performance

Showing captured bind values from Execution Plans and Captured binds #JoelKallmanDay

Hello,

In my previous post, I showed how to see USED and PEEKED bind variables from SQL Monitor views, either in memory and/or from AWR repository.

In this new one, I show how to see these same values from Execution Plans (either GV$SQL_PLAN and/or DBA_HIST_SQL_PLAN) as well as from Captured SQL binds (either from GV$SQL_BIND_CAPTURE and/or DBA_HIST_SQLBIND).

So, here is the same test case I’ve created in the previous post:

create table t (
col_n number, col_ch char, col_vc varchar2(10),
col_dt date, col_ts timestamp);
 
Table created.
 
define mydt="2023/10/01 12:01:12"
define myts="2023/10/01 12:01:12.123"
 
insert into t values (
1, 'A', 'Edu$!123', to_date('&mydt','yyyy-mm-dd hh24:mi:ss'), to_timestamp('&myts','yyyy-mm-dd hh24:mi:ss.ff'));
 
1 row created.

Now let’s run a query with binds:

alter session set nls_date_format='yyyy-mm-dd hh24:mi:ss';
alter session set nls_timestamp_format='yyyy-mm-dd hh24:mi:ss.ff';

set serveroutput on
declare
    n number;
    c char;
    vc varchar2(10);
    dt date;
    ts timestamp;
    function run_query
    return number is
        rn number;
    begin
        select COL_N
        into rn
            from t
            where COL_VC!='MYQUERY3'
            and COL_N = n
            and COL_CH = c
            and COL_VC like vc
            and COL_DT = dt
            and COL_TS = ts
            ;
        return rn;
    exception when no_data_found then return (-1);
    end;
begin
    n := 1;
    c := 'A';
    vc := 'Edu%';
    dt := to_date('&mydt','yyyy-mm-dd hh24:mi:ss');
    ts := to_timestamp('&myts','yyyy-mm-dd hh24:mi:ss.ff');
    dbms_output.put_line(run_query);
    n := 2;
    c := 'B';
    vc := 'ABC%';
    dt := sysdate;
    ts := systimestamp; 
    dbms_output.put_line(run_query);
end;
/

1
-1

Let me find the SQL_ID of my query:

select sql_id, executions, sql_text
from v$sql
where sql_text like q'[SELECT %COL_VC!='MYQUERY3'%]';

SQL_ID        EXECUTIONS SQL_TEXT
------------- ---------- ------------------------------------------------------------
fb3gqgd87ac8h          2 SELECT COL_N FROM T WHERE COL_VC!='MYQUERY3' AND COL_N = :B5

1 row selected.

Now, here is the script to get the bind values from the SQL Plans:

col bind_name format a10 wrap
col peeked_value format a40
col datatype head "DATA_TYPE" for a20
col src for a9

def sqlid="fb3gqgd87ac8h"
def datini=sysdate-1
def datfin=sysdate

select src, INST_ID, sql_id, plan_hash_value, child_number, c.bind_name, c.bind_pos, c.bind_type,
	decode(bind_type,1,'VARCHAR2',2,'NUMBER',12,'DATE',96,'CHAR',180,'TIMESTAMP',181,'TIMESTAMP WITH TZ',231,'TIMESTAMP WITH LTZ',to_char(bind_type)) datatype,
	case
		 when c.bind_type = 1 /*varchar2*/ then utl_raw.cast_to_varchar2(c.bind_data)
		 when c.bind_type = 2 /*number*/ then to_char(utl_raw.cast_to_number(c.bind_data))
		 when c.bind_type = 96 /*char*/ then to_char(utl_raw.cast_to_varchar2(c.bind_data))
		 when c.bind_type = 12 /*date*/ then TO_CHAR(dbms_stats.convert_raw_to_date(c.bind_data),'yyyy-mm-dd hh24:mi:ss')
		 when bind_type = 180 /*timestamp*/ then 
				to_char(
					to_timestamp(
						to_char(
							dbms_stats.convert_raw_to_date(hextoraw(substr(bind_data,1,14)))
							,'yyyy-mm-dd hh24:mi:ss')
						,'yyyy-mm-dd hh24:mi:ss') 
						+ numtodsinterval(nvl(to_number(hextoraw(substr(bind_data,15,8)),'XXXXXXXX')/1e9,0), 'SECOND')
					,'yyyy-mm-dd hh24:mi:ss.ff9')
		 else 'Not printable'
	end as peeked_value
from (
	select 'SQLPLAN-M' src, sql_id, plan_hash_value, OTHER_XML, child_number, INST_ID
	from gv$sql_plan
	UNION ALL
	select 'SQLPLAN-H' src, sql_id, plan_hash_value, OTHER_XML, to_number(NULL) as child_number, to_number(NULL) as INST_ID
	from dba_hist_sql_plan
	join dba_hist_snapshot using (DBID)
	where END_INTERVAL_TIME between &datini and &datfin
) p, 
xmltable
	(
	'/*/peeked_binds/bind' passing xmltype(p.other_xml)
	columns 
		bind_name varchar2(30) path './@nam',
		bind_pos number path './@pos',
		bind_type number path './@dty',
		bind_data  raw(2000) path '.'
	) c
where sql_id = '&sqlid'
and p.other_xml is not null
order by src, inst_id, sql_id, plan_hash_value, child_number, bind_pos, peeked_value
/

SRC        In SQL_ID             PLAN_HV CHILD_NUMBER BIND_NAME    BIND_POS  BIND_TYPE DATA_TYPE            PEEKED_VALUE
--------- --- ------------- ------------ ------------ ---------- ---------- ---------- -------------------- ----------------------------------------
SQLPLAN-M   1 fb3gqgd87ac8h   1601196873            0 :B5                 1          2 NUMBER               1
SQLPLAN-M   1 fb3gqgd87ac8h   1601196873            0 :B4                 2         96 CHAR                 A
SQLPLAN-M   1 fb3gqgd87ac8h   1601196873            0 :B3                 3          1 VARCHAR2             Edu%
SQLPLAN-M   1 fb3gqgd87ac8h   1601196873            0 :B2                 4         12 DATE                 2023-10-01 12:01:12
SQLPLAN-M   1 fb3gqgd87ac8h   1601196873            0 :B1                 5        180 TIMESTAMP            2023-10-01 12:01:12.123000000

5 rows selected.

NOTE: you can get peeked values from SQL Plans direct in your execution plan. Maria Colgan explains how you can do that here.

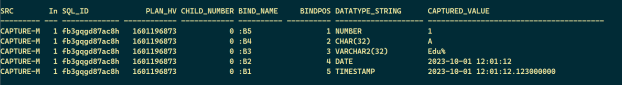
And here is the script to get the bind values from the Captured binds:

col bind_name format a10 wrap
col captured_value format a40
col DATATYPE_STRING for a20
col src for a9

def sqlid="fb3gqgd87ac8h"
def datini=sysdate-1
def datfin=sysdate

select DISTINCT src, INST_ID, sql_id, plan_hash_value, child_number, 
	name as bind_name, position as bindpos, DATATYPE_STRING,
	case
		 when DATATYPE in (1,2,96) /*varchar2,number,char*/ then VALUE_STRING
         when DATATYPE = 12 /*date*/ then to_char(anydata.accessDate(value_anydata),'yyyy-mm-dd hh24:mi:ss')
         when DATATYPE = 180 /*timestamp*/ then to_char(anydata.accesstimestamp(value_anydata),'yyyy-mm-dd hh24:mi:ss.ff9')
		else 'Not printable'
	END captured_value
from (
	select 'CAPTURE-M' src, 
		sql_id, child_number, PLAN_HASH_VALUE, INST_ID, 
		name, position, datatype, DATATYPE_STRING, value_string, value_anydata
	from gv$sql_bind_capture
	join gv$sql s using (INST_ID, sql_id, child_number)
	UNION ALL
	select 'CAPTURE-H' src, 
		sql_id, to_number(NULL) as child_number, to_number(NULL) PLAN_HASH_VALUE, INSTANCE_NUMBER as INST_ID, 
		name, position, datatype, DATATYPE_STRING, value_string, value_anydata
	from dba_hist_sqlbind
	join dba_hist_snapshot using (DBID, INSTANCE_NUMBER, SNAP_ID)
	where END_INTERVAL_TIME between &datini and &datfin
	) c
where sql_id = '&sqlid'
order by src, INST_ID, sql_id, plan_hash_value, child_number, position, captured_value
/

SRC        In SQL_ID             PLAN_HV CHILD_NUMBER BIND_NAME     BINDPOS DATATYPE_STRING      CAPTURED_VALUE
--------- --- ------------- ------------ ------------ ---------- ---------- -------------------- ----------------------------------------
CAPTURE-M   1 fb3gqgd87ac8h   1601196873            0 :B5                 1 NUMBER               1
CAPTURE-M   1 fb3gqgd87ac8h   1601196873            0 :B4                 2 CHAR(32)             A
CAPTURE-M   1 fb3gqgd87ac8h   1601196873            0 :B3                 3 VARCHAR2(32)         Edu%
CAPTURE-M   1 fb3gqgd87ac8h   1601196873            0 :B2                 4 DATE                 2023-10-01 12:01:12
CAPTURE-M   1 fb3gqgd87ac8h   1601196873            0 :B1                 5 TIMESTAMP            2023-10-01 12:01:12.123000000

5 rows selected.

And that’s it for today.

See you next time!

Showing BIND values from SQL Monitor views, even when the SQL Monitor report itself does not show it correctly

Hello,

Sometimes, when you have to troubleshoot complex performance issues related to execution plans for queries that use bind variables, knowing the bind values used by the Optimizer becomes very important for the troubleshooting process. And in these cases, not only the bind value used at runtime for a particular execution is important, but also the value used at PARSING time (known as PEEKED value).

So, one wonderful tool to analyze SQL Executions is the SQL Monitor Report. If you don’t know much about SQL Monitor, please read here where Maria Colgan explains very well how to get the most out of this tool.

Well, although SQL Monitor is a very useful tool that I use all the time for performance analysis (I myself have written a few posts about it, find them here), there is something that several times made me sad and lose time: not always the SQL Monitor report shows all bind variables used and/or peeked.

Take for example this SQL Monitor report:

Note that all the PEEKED values as well as the TIMESTAMP datatype value in the Value column (the values used at runtime) are not shown correctly. Actually, the values presented are in RAW format, the way Oracle stores them in the database. Easy to understand that seeing values in the RAW format does not help much right?

I can’t confirm if this is true in all databases and all versions, but all that I have access at this point have the same “issue”. The database where the above report was generated is version 19.20.

So, in this post I will provide you a script that shows all the bind variable values for any generated SQL Monitor report in your database, either if it’s in memory (GV$SQL_MONITOR) or in the AWR repository (persisted in DBA_HIST_REPORTS%).

The script shows both the USED and PEEKED values, for all most common data types including TIMESTAMP. I did not implement it yet for TIMESTAMP WITH TIME ZONE and TIMESTAMP WITH LOCAL TIME ZONE, but it’s not that difficult so I will probably come up with an updated version soon.

As usual, I will provide you a test case so you can test the script even if you don’t have real data to test against.

So, let’s start creating a table and some data:

create table t (
col_n number, col_ch char, col_vc varchar2(10),
col_dt date, col_ts timestamp);

Table created.

define mydt="2023/10/01 12:01:12"
define myts="2023/10/01 12:01:12.123"

insert into t values (
1, 'A', 'Edu$!123', to_date('&mydt','yyyy-mm-dd hh24:mi:ss'), to_timestamp('&myts','yyyy-mm-dd hh24:mi:ss.ff'));

1 row created.

Note that I defined two SQL Plus variables with a DATE and a TIMESTAMP values, just to make it easy to reuse the same values later on for the queries I’m going to execute.

Let me format the output for DATE and TIMESTAMP types and check the inserted data:

alter session set nls_date_format='yyyy-mm-dd hh24:mi:ss';
alter session set nls_timestamp_format='yyyy-mm-dd hh24:mi:ss.ff';
col col_N for 999
col col_ts for a26
select * from t;

Session altered.

Session altered.

COL_N C COL_VC     COL_DT              COL_TS
----- - ---------- ------------------- --------------------------
    1 A Edu$!123   2023-10-01 12:01:12 2023-10-01 12:01:12.123000

1 row selected.

Ok, now I will run a query with bind variables twice: the first execution will parse the query and generate the execution plan with bind values passed; the second one will use different values but use the same plan (with the same peeked values):

set serveroutput on
declare
	n number;
	c char;
	vc varchar2(10);
	dt date;
	ts timestamp;
	function run_query
	return number is
		rn number;
	begin
		select /*+ monitor */ COL_N
		into rn
			from t
			where COL_VC!='MYQUERY'
			and COL_N = n
			and COL_CH = c
			and COL_VC like vc
			and COL_DT = dt
			and COL_TS = ts
			;
		return rn;
	exception when no_data_found then return (-1);
	end;
begin
	n := 1;
	c := 'A';
	vc := 'Edu%';
	dt := to_date('&mydt','yyyy-mm-dd hh24:mi:ss');
	ts := to_timestamp('&myts','yyyy-mm-dd hh24:mi:ss.ff');
	dbms_output.put_line(run_query);
	n := 2;
	c := 'B';
	vc := 'ABC%';
	dt := sysdate;
	ts := systimestamp;	
	dbms_output.put_line(run_query);
end;
/

1
-1

(EDIT 2023/10/10: I just noticed that I included parameters in my function but I never used their values, and it worked because the variables were declared globally so the function have access to them. The code was adjusted).

Note: I am using a PL/SQL block to declare the variables with the proper data type. I am not using SQL Plus bind variables because they cannot be declared directly as DATE or TIMESTAMP.

My PL/SQL block has a function that executes the SQL with the variables received as parameters, and returns the number value in COL_N column, or -1 if no record is found.

After running the PL/SQL block, we will have the two executions stored in the V$SQL_MONITOR view. Please note that I included in the query a string MYQUERY to help identify the query. If you need to rerun the test again you may want to change the string:

col sql_text for a60 trunc
select sql_id, sql_exec_start, sql_exec_id, sql_text
from v$sql_monitor
where sql_text like 'SELECT /*+ monitor */%MYQUERY%';

SQL_ID        SQL_EXEC_START      SQL_EXEC_ID SQL_TEXT
------------- ------------------- ----------- ------------------------------------------------------------
gs8mw9wayq4dm 2023-10-09 15:35:54    16777216 SELECT /*+ monitor */ COL_N FROM T WHERE COL_VC!='MYQUERY' A
gs8mw9wayq4dm 2023-10-09 15:35:54    16777217 SELECT /*+ monitor */ COL_N FROM T WHERE COL_VC!='MYQUERY' A

Run the following query to generate the SQL Monitor for the last execution:

alter session set events = 'emx_control compress_xml=none';
set lines 32767 trimout on trimspool on head off feed off echo off timing off termout off long 1000000 longchunksize 1000000 ver off pages 0
spool sqlmon.html
select DBMS_SQL_MONITOR.report_sql_monitor(
sql_id => max(a.sql_id),
sql_exec_id => max(a.sql_exec_id),
sql_exec_start => max(a.sql_exec_start),
report_level=>'ALL',type=>'ACTIVE')
from v$sql_monitor a
where sql_text like 'SELECT /*+ monitor */%MYQUERY%';
spool off

Then, open the SQL Monitor in a web browser, click on the SQL Text tab and expand the SQL Binds section:

See? Again, all the PEEKED values are presented as RAW, as well as the TIMESTAMPs.

My friend Marcus Vinicius Miguel Pedro found the Doc ID 2111950.1 that points to a Bug, but at least until Oracle v. 19.20 which I am using, the bug is still there. And the note mentions only the TIMESTAMP issue, but not the PEEKED values.

So, here I present the script you can use to properly get all PEEKED and USED values, for data types NUMBER, CHAR, VARCHAR2, DATE and TIMESTAMP.

def sqlid="gs8mw9wayq4dm"
def exec=""
def phv=""
def ins="1"
def datini="sysdate-30"
def datfin="sysdate"

col bind_name format a10 wrap
col used_value format a40
col peeked_value format a40

WITH
reports as (
	select *
	from (
		select snap_id, INSTANCE_NUMBER, r.key1 as sql_id, to_number(r.key2) as sql_exec_id, d.REPORT, r.report_summary,
			to_number(EXTRACTVALUE(XMLType(r.report_summary),'/report_repository_summary/sql/plan_hash')) SQL_PLAN_HASH_VALUE
		from DBA_HIST_REPORTS_DETAILS d 
		natural join DBA_HIST_REPORTS r
		where r.component_name = 'sqlmonitor'
		AND r.report_name = 'main'
		AND KEY1='&sqlid'
		and ('&exec' is null or KEY2 = to_number('&exec'))
		and ('&ins' is null or INSTANCE_NUMBER = to_number(nvl('&ins','1')))
		and GENERATION_TIME between &datini and &datfin
	)
	where ('&phv' is null or SQL_PLAN_HASH_VALUE = to_number('&phv'))
),
reports_u as (
	select
		snap_id, INSTANCE_NUMBER, sql_id, sql_exec_id, bind_name, bind_pos, bind_type, bind_typestr,
 		case
			 when bind_type in (1,2,96) /*varchar2,number,char*/ then bind_data
 			 when bind_type = 12 /*date*/ then to_char(to_date(bind_data,'mm/dd/yyyy hh24:mi:ss'),'yyyy-mm-dd hh24:mi:ss')
 			 when bind_type = 180 /*timestamp*/ then 
					to_char(
						to_timestamp(
							to_char(
								dbms_stats.convert_raw_to_date(hextoraw(substr(bind_data,1,14)))
								,'yyyy-mm-dd hh24:mi:ss')
							,'yyyy-mm-dd hh24:mi:ss') 
							+ numtodsinterval(nvl(to_number(hextoraw(substr(bind_data,15,8)),'XXXXXXXX')/1e9,0), 'SECOND')
						,'yyyy-mm-dd hh24:mi:ss.ff9')
 			 else 'Not printable'
 		end used_value
	from reports r
	cross join xmltable
		(
		'/report/sql_monitor_report/binds/bind' passing xmltype(REPORT)
		columns 
			bind_name varchar2(30) path './@name',
			bind_pos  number path './@pos',
			bind_type number path './@dty',
			bind_typestr varchar2(30) path './@dtystr',
			bind_data varchar2(1000) path '.'
		) c
),
reports_p as (
	select 
		snap_id, INSTANCE_NUMBER, sql_id, sql_exec_id, bind_name, bind_pos, bind_type, bind_typestr,
 		case
 			 when bind_type = 1 /*varchar2*/ then utl_raw.cast_to_varchar2(bind_data)
 			 when bind_type = 2 /*number*/ then to_char(utl_raw.cast_to_number (bind_data))
 			 when bind_type = 96 /*char*/ then to_char(utl_raw.cast_to_varchar2(bind_data))
 			 when bind_type = 12 /*date*/ then TO_CHAR(dbms_stats.convert_raw_to_date(bind_data),'yyyy-mm-dd hh24:mi:ss')
 			 when bind_type = 180 /*timestamp*/ then 
					to_char(
						to_timestamp(
							to_char(
								dbms_stats.convert_raw_to_date(hextoraw(substr(bind_data,1,14)))
								,'yyyy-mm-dd hh24:mi:ss')
							,'yyyy-mm-dd hh24:mi:ss') 
							+ numtodsinterval(nvl(to_number(hextoraw(substr(bind_data,15,8)),'XXXXXXXX')/1e9,0), 'SECOND')
						,'yyyy-mm-dd hh24:mi:ss.ff9')
 			 else 'Not printable'
 		end peeked_value
	from reports r
	cross join xmltable
		(
		'/report/sql_monitor_report/plan/operation/other_xml/peeked_binds/bind' 
		passing xmltype(REPORT)
		columns 
			bind_name varchar2(30) path './@nam',
			bind_pos  number path './@pos',
			bind_type number path './@dty',
			bind_typestr varchar2(30) path './@dtystr',
			bind_data varchar2(1000) path '.'
		) p
),
reports_binds as (
	select snap_id, INSTANCE_NUMBER, sql_id, sql_exec_id, bind_name, bind_pos, 
		u.bind_type, u.bind_typestr,
		u.used_value, p.peeked_value
	from reports_p p
	full join reports_u u using (snap_id, INSTANCE_NUMBER, sql_id, sql_exec_id, bind_name, bind_pos)
	order by bind_pos
),
sqlmon as (
	select INST_ID, sql_id, sql_exec_id, BINDS_XML, SQL_CHILD_ADDRESS, SQL_PLAN_HASH_VALUE
	from gv$sql_monitor m
	where SQL_ID='&sqlid'
	and ('&exec' is null or SQL_EXEC_ID = to_number('&exec'))
	and ('&ins' is null or INST_ID = to_number(nvl('&ins','1')))
	and ('&phv' is null or SQL_PLAN_HASH_VALUE = to_number('&phv'))
	and SQL_PLAN_HASH_VALUE <> 0
	and nvl(PX_QCSID,SID) = SID and nvl(PX_QCINST_ID,INST_ID) = INST_ID --don't show Parallel slaves
	and SQL_EXEC_START between &datini and &datfin
),
sqlmon_u as (
	select
		INST_ID, sql_id, sql_exec_id, bind_name, bind_pos, bind_type, bind_typestr, 
 		case
			 when bind_type in (1,2,96) /*varchar2,number,char*/ then bind_data
 			 when bind_type = 12 /*date*/ then to_char(to_date(bind_data,'mm/dd/yyyy hh24:mi:ss'),'yyyy-mm-dd hh24:mi:ss')
 			 when bind_type = 180 /*timestamp*/ then 
					to_char(
						to_timestamp(
							to_char(
								dbms_stats.convert_raw_to_date(hextoraw(substr(bind_data,1,14)))
								,'yyyy-mm-dd hh24:mi:ss')
							,'yyyy-mm-dd hh24:mi:ss') 
							+ numtodsinterval(nvl(to_number(hextoraw(substr(bind_data,15,8)),'XXXXXXXX')/1e9,0), 'SECOND')
						,'yyyy-mm-dd hh24:mi:ss.ff9')
 			 else 'Not printable'
 		end as used_value
	from sqlmon
	cross join xmltable
		(
			'/binds/bind' passing xmltype(BINDS_XML)
			columns 
				bind_name varchar2(30) path './@name',
				bind_pos  number path './@pos',
				bind_type number path './@dty',
				bind_typestr varchar2(30) path './@dtystr',
				bind_data varchar2(1000) path '.'
		) u
	where BINDS_XML is not null
),
sqlmon_plan_p as (
	select
		m.INST_ID, m.sql_id, m.sql_exec_id, x.bind_name, x.bind_pos, x.bind_type,  
 		case
			 when bind_type = 1 /*varchar2*/ then utl_raw.cast_to_varchar2(bind_data)
 			 when bind_type = 2 /*number*/ then to_char(utl_raw.cast_to_number (bind_data))
 			 when bind_type = 96 /*char*/ then to_char(utl_raw.cast_to_varchar2(bind_data))
 			 when bind_type = 12 /*date*/ then TO_CHAR(dbms_stats.convert_raw_to_date(bind_data),'yyyy-mm-dd hh24:mi:ss')
 			 when bind_type = 180 /*timestamp*/ then 
					to_char(
						to_timestamp(
							to_char(
								dbms_stats.convert_raw_to_date(hextoraw(substr(bind_data,1,14)))
								,'yyyy-mm-dd hh24:mi:ss')
							,'yyyy-mm-dd hh24:mi:ss') 
							+ numtodsinterval(nvl(to_number(hextoraw(substr(bind_data,15,8)),'XXXXXXXX')/1e9,0), 'SECOND')
						,'yyyy-mm-dd hh24:mi:ss.ff9')
 			 else 'Not printable'
 		end peeked_value
	from sqlmon m, gv$sql_plan p,
        xmltable
		(
			'/*/peeked_binds/bind' passing xmltype(p.OTHER_XML)
			columns 
				bind_name varchar2(30) path './@nam',
				bind_pos  number path './@pos',
				bind_type number path './@dty',
				bind_data varchar2(1000) path '.'
		) x
	where p.OTHER_XML is not null
    and m.inst_id = p.inst_id
    and m.sql_id = p.sql_id
    and m.SQL_CHILD_ADDRESS = p.child_address
),
sqlmon_binds as (
	select INST_ID, sql_id, sql_exec_id, bind_name, bind_pos, 
		u.bind_type, u.bind_typestr,
		u.used_value, p.peeked_value
	from sqlmon_plan_p p
	full join sqlmon_u u using (INST_ID, sql_id, sql_exec_id, bind_name, bind_pos)
)
select 'HIST' src, snap_id, instance_number as inst, sql_id, sql_exec_id, 
	bind_name, bind_pos, bind_type, bind_typestr, used_value, peeked_value
from reports_binds
UNION ALL
select 'MEM' src, NULL as snap_id, inst_id as inst, sql_id, sql_exec_id, 
	bind_name, bind_pos, bind_type, bind_typestr, used_value, peeked_value
from sqlmon_binds
order by src, snap_id, inst, sql_id, sql_exec_id, bind_pos, used_value, peeked_value
/

SRC     SNAP_ID       INST SQL_ID        SQL_EXEC_ID BIND_NAME    BIND_POS  BIND_TYPE BIND_TYPESTR                   USED_VALUE                               PEEKED_VALUE
---- ---------- ---------- ------------- ----------- ---------- ---------- ---------- ------------------------------ ---------------------------------------- ----------------------------------------
HIST        214          1 gs8mw9wayq4dm    16777216 :B5                 1          2 NUMBER                         1                                        1
HIST        214          1 gs8mw9wayq4dm    16777216 :B4                 2         96 CHAR(32)                       A                                        A
HIST        214          1 gs8mw9wayq4dm    16777216 :B3                 3          1 VARCHAR2(32)                   Edu%                                     Edu%
HIST        214          1 gs8mw9wayq4dm    16777216 :B2                 4         12 DATE                           2023-10-01 12:01:12                      2023-10-01 12:01:12
HIST        214          1 gs8mw9wayq4dm    16777216 :B1                 5        180 TIMESTAMP                      2023-10-01 12:01:12.123000000            2023-10-01 12:01:12.123000000
HIST        214          1 gs8mw9wayq4dm    16777217 :B5                 1          2 NUMBER                         2                                        1
HIST        214          1 gs8mw9wayq4dm    16777217 :B4                 2         96 CHAR(32)                       B                                        A
HIST        214          1 gs8mw9wayq4dm    16777217 :B3                 3          1 VARCHAR2(32)                   ABC%                                     Edu%
HIST        214          1 gs8mw9wayq4dm    16777217 :B2                 4         12 DATE                           2023-10-09 15:35:54                      2023-10-01 12:01:12
HIST        214          1 gs8mw9wayq4dm    16777217 :B1                 5        180 TIMESTAMP                      2023-10-09 15:35:54.432043000            2023-10-01 12:01:12.123000000
MEM                      1 gs8mw9wayq4dm    16777216 :B5                 1          2 NUMBER                         1                                        1
MEM                      1 gs8mw9wayq4dm    16777216 :B4                 2         96 CHAR(32)                       A                                        A
MEM                      1 gs8mw9wayq4dm    16777216 :B3                 3          1 VARCHAR2(32)                   Edu%                                     Edu%
MEM                      1 gs8mw9wayq4dm    16777216 :B2                 4         12 DATE                           2023-10-01 12:01:12                      2023-10-01 12:01:12
MEM                      1 gs8mw9wayq4dm    16777216 :B1                 5        180 TIMESTAMP                      2023-10-01 12:01:12.123000000            2023-10-01 12:01:12.123000000
MEM                      1 gs8mw9wayq4dm    16777217 :B5                 1          2 NUMBER                         2                                        1
MEM                      1 gs8mw9wayq4dm    16777217 :B4                 2         96 CHAR(32)                       B                                        A
MEM                      1 gs8mw9wayq4dm    16777217 :B3                 3          1 VARCHAR2(32)                   ABC%                                     Edu%
MEM                      1 gs8mw9wayq4dm    16777217 :B2                 4         12 DATE                           2023-10-09 15:35:54                      2023-10-01 12:01:12
MEM                      1 gs8mw9wayq4dm    16777217 :B1                 5        180 TIMESTAMP                      2023-10-09 15:35:54.432043000            2023-10-01 12:01:12.123000000

20 rows selected.

As you can see in the putput above, all the variables were presented with their correct, readable values.

Please note that I have included in the script the following filters you can use:

  • SQL_ID (mandatory)
  • SQL_EXEC_ID
  • PHV (SQL Plan Hash Value)
  • INS (instance)
  • DATINI and DATFIN (for the period to research)

That it for today.

I hope you can find it useful.

EDIT: I forgot to mention some of the sources that helped me to decode the information and build the script: Jonathan Lewis and Bertrand Drouvot, and Tanel Poder. What a Team hum 🙂 ?

See you next time!

Viewing locks in ASH – again, but now with a timeline and a waiting queue

Hello,

In my last post, I presented a tricky situation that happened in a client’s Production database, that caused enq: TM – contention waits, and in order to determine the root cause I queried ASH looking for locks. I mentioned there that I used a different script that presented the locks much like the good, old Oracle provided utllockt.sql script, which clearly shows the locks in a queue that allows us to determine who is the real troubler (i.e., the session that is/was locking but not also locked by another one).

When you have a complex lock situation, you may have several sessions that are holding/locking others, but they themselves are also waiting/being locked by another session, in a queue. And then you have usually one, at the top of the queue, that is holding all others direct or indirectly, but not waiting on any session. This is usually the ” villain” we are looking for.

It’s worth mentioning that when I say lock here, I am referring to any possible wait event that could make other sessions to wait. This could be the most known/common lock wait enq: TX – row lock contention, the enq: TM – contention , but it can also be something like a library cache lock, log file sync and other locks related to instance activity.

For example, this is the image in the previous post that highlights what was happening exactly at 2023-08-01 17:26:53:

Can you see how the queue of locks is shown with an indentation in the SESSION (SID) column? This is how utllockt.sql used to show locks, showing that the less indented session is the one holding all others. In the picture above, it is the top row in yellow, SID 8359.

So, in this post I will present the script that I’ve created to show this queue of locks, in a timeline for every SAMPLE_TIME in ASH where such locks existed. With this script, you can easily determine exactly when the problematic situation started, and what was the session that started holding others. I have improved the script a bit after my last post, so the columns and the output is not exactly the same. I have also included some filters that you can uncomment to see only what you want, the right way. I will explain this better below.

The structure of the SQL code is very different from what I presented in a recent post on how to show locks in ASH. In that case, I was interest in finding information for a blocking session, even if it was INACTIVE at the moment of the lock, thus not being captured by ASH at that point in time. I then searched backwards to see if the holding session was active in the recent past, and then present the relevant information to hold identify the holder. In this new one, the target is to show the timeline and the chain of the locks. I did not include in this new one the “intelligence” of looking backwards to find information about the holding session if it’s INACTIVE. It’s an improvement I will do an post soon, so stay tuned.

All that being said, let me present the script:

def DATINI="2023-08-01:17:25:00" 
def DATFIN="2023-08-01:17:28:00" 

alter session set nls_date_format='yyyy-mm-dd hh24:mi:ss';

clear breaks
col sidqueue for a20 head "SID|QUEUE"
col COMPLETE_SESSION_ID for a14 head "SESSION_ID"
col USERNAME for a15 wrap
col MODULE for a15 wrap
col EVENT for a20 wrap
col OBJ for a30 wrap
col MINUTOS for 999.9
break on sample_time skip page on level
set pages 1000

with ash as (
	select a.*,
		O.OWNER || '.' || O.OBJECT_NAME as obj,
		u.username, 
		case when blocking_session is NULL then 'N' else 'Y' end IS_WAITING,
		case
			when 
			instr(
				listagg(DISTINCT '.'||blocking_session||'.') 
					WITHIN GROUP (order by blocking_session) 
					OVER (partition by sample_id) ,
				'.'||session_id||'.' 
				) = 0 
			then 'N'
			else 'Y'
			end as IS_HOLDING,
		case
			when blocking_session is NULL then NULL
			when instr(
				listagg(DISTINCT '.'||session_id||'.') 
					WITHIN GROUP (order by session_id) 
					OVER (partition by sample_id) ,
				'.'||blocking_session||'.' 
				) = 0 
			then 'N'
			else 'Y'
			end as IS_BLOCKING_SID_ACTIVE
	from dba_hist_active_sess_history a
	left join dba_objects o on o.object_id = a.CURRENT_OBJ#
	left join dba_users u on u.user_id = a.user_id
	where SAMPLE_TIME between &datini and &datfin
),
ash_with_inactive as (
-- I need to include the inactive blocking sessions because ASH does not record INACTIVE
    select 
        sample_id, cast(sample_time as date) as sample_time, 
        session_id, session_serial#, instance_number,
        blocking_session, blocking_session_serial#, blocking_inst_id,
        sql_id, sql_exec_start, sql_exec_id, TOP_LEVEL_SQL_ID, XID, 
        username, module, nvl(event,'On CPU') event, 
		sysdate + ( (sample_time - min(sample_time) over (partition by session_id, session_serial#, instance_number, event_id, SEQ#)) * 86400) - sysdate as swait,
        obj, 
        IS_WAITING, IS_HOLDING, 'Y' IS_ACTIVE, IS_BLOCKING_SID_ACTIVE
    from ash
    UNION ALL
    select DISTINCT 
        sample_id, cast(sample_time as date) as sample_time, 
        blocking_session as session_id, blocking_session_serial# as session_serial#, blocking_inst_id as instance_number,
        NULL as blocking_session, NULL as blocking_session_serial#, NULL as blocking_instance,
        NULL as sql_id, NULL as sql_exec_start, NULL as sql_exec_id, NULL as TOP_LEVEL_SQL_ID, NULL as XID, 
        NULL as username, NULL as module, '**INACTIVE**' as event, NULL as swait, NULL as obj, 
        'N' as IS_WAITING, 'Y' as IS_HOLDING, 'N' IS_ACTIVE, null as IS_BLOCKING_SID_ACTIVE
    from ash a1
    where IS_BLOCKING_SID_ACTIVE = 'N'  
),
locks as (
    select b.*,
        listagg(DISTINCT '.'||event||'.') within group (order by lock_level) over (partition by sample_id, top_level_sid) event_chain,
        listagg(DISTINCT '.'||username||'.') within group (order by lock_level) over (partition by sample_id, top_level_sid) user_chain,
        listagg(DISTINCT '.'||module||'.') within group (order by lock_level) over (partition by sample_id, top_level_sid) module_chain,
        listagg(DISTINCT '.'||obj||'.') within group (order by lock_level) over (partition by sample_id, top_level_sid) obj_chain,
        listagg(DISTINCT '.'||xid||'.') within group (order by lock_level) over (partition by sample_id, top_level_sid) xid_chain,
        listagg(DISTINCT '.'||session_id||'.') within group (order by lock_level) over (partition by sample_id, top_level_sid) sid_chain,
        listagg(DISTINCT '.'||sql_id||'.') within group (order by lock_level) over (partition by sample_id, top_level_sid) sql_id_chain
    from (
        select a.*,
            rownum rn, level lock_level,
            case when level > 2 then lpad(' ',2*(level-2),' ') end || 
                case when level > 1 then '+-' end || session_id as sidqueue,
            session_id || ',' || session_serial# || '@' || instance_number COMPLETE_SESSION_ID,
            CONNECT_BY_ROOT session_id as top_level_sid
        from ash_with_inactive a
        connect by
            prior sample_id = sample_id
            and prior session_id = blocking_session 
            and prior instance_number = blocking_inst_id 
            and prior session_serial# = blocking_session_serial# 
        start with
            IS_HOLDING = 'Y' and IS_WAITING = 'N'
        order SIBLINGS by sample_time, swait desc
    ) b
)
select
--     sample_id, 
    sample_time, lock_level, sidqueue, COMPLETE_SESSION_ID, 
    username, module, xid,
    event, swait, OBJ,
    sql_id, sql_exec_start, sql_exec_id, top_level_sql_id
from locks
where 1=1
--and event_chain like '%TM%contention%'
--and user_chain like '%PROD_BATCH%'
--and module_chain like '%PB%'
--and obj_chain like '%PGM%'
--and xid_chain like '%1300%'
--and sid_chain like '%7799%'
--and sql_id_chain like '%fmxzsf8gxn0ym%'
order by rn
/

Here are some comments about the script:

  • You have to provide the time interval you want to search into with the variables &datini and &datfin in the format ‘yyyy-mm-dd:hh24:mi:ss’, just like I did in the first two lines of the block above.
  • I am searching the historical view DBA_HIST_ACTIVE_SESS_HISTORY. You can easily adjust it to search the recent history in GV$ACTIVE_SESSION_HISTORY, but just changing the table name and the instance column name (INST_ID instead of INSTANCE_NUMBER).
  • The script was not tested in a RAC environment. Although it was created with also RAC in mind, there may be a bug that I did not identify since I didn’t test it. If you find something wrong, let me know.
  • In order to use the CONNECT BY hierarchical query, I had to manually “create” rows in my result for the holding sessions, to serve as the root rows for each queue. This is necessary because there may be INACTIVE sessions holding others, but not captured by ASH (since ASH by default only captures ACTIVE sessions).
  • I’ve created strings with the chain of events, users, modules, objects, transaction IDs, SIDs and SQL_IDs for each queue of locks. This way you can properly filter only the queues of your interest (using LIKE), that had a particular event, or a particular username, and so on. For this, I left commented the filters you can use. Uncomment the ones that make sense for you search in particular. Please note that I could not simply filter the source without creating that chain. For example, if I filter by USERNAME directly, the results would show only the rows of that user, not the entire queue of locks that user was involved in. So the result would be wrong.
  • The column SWAIT shows the number of seconds the session was waiting for that particular event, but this considers only the time window of the query and considers the difference in time between the current sample time and the first sample time of that particular event (and sequence). So, it may not be 100% accurate if the event started before the time window of the query, and because it considers the ASH samples that occur every 10s (which means the actual number of seconds could be +/- 10s of what is shown).

Now, I will create a queue of locks in order to demonstrate the script and allow you to see it in action as well ;-).

Session 1

So, first I will create a table with some data for me to play with:

create table t (id number, last_update date);
insert into t select level, sysdate from dual connect by level <= 5;
commit;
select * from t;

Table created.

5 rows created.

Commit complete.

        ID LAST_UPDATE
---------- -------------------
         1 2023-10-02 15:58:32
         2 2023-10-02 15:58:32
         3 2023-10-02 15:58:32
         4 2023-10-02 15:58:32
         5 2023-10-02 15:58:32

5 rows selected.

Then, I will update the first row and let the session inactive holding the row.

select userenv('sid') from dual;

USERENV('SID')
--------------
           278

update t set last_update = sysdate where id=1;

1 row updated.

Session 2

Now, in a second session, I will update the row with ID=2 and then try to update the same row of Session 1, which will will be locked:

select userenv('sid') from dual;

USERENV('SID')
--------------
          1206

update t set last_update = sysdate where id=2;

1 row updated.

update t set last_update = sysdate where id=1;
-- This will be locked

Session 3

After waiting a few seconds (I’ve included a sleep in the code, just to make sure we have distinct samples with just the first lock situation and then both locks), I will start a third session and also try to update the row with ID=2, which will be locked.

exec dbms_session.sleep(30);

PL/SQL procedure successfully completed.

select userenv('sid') from dual;

USERENV('SID')
--------------
            52

update t set last_update = sysdate where id=2;
-- This will be locked

Monitoring Session

Now, in another session, I will run the script and see the results (for brevity and clarity, I am only showing the rows for the last moment before Session 3 was locked and the first moment after it:

def datini=sysdate-1/24
def datfin=sysdate

@ashlockq

...
...
                               SID
SAMPLE_TIME         LOCK_LEVEL QUEUE        SESSION_ID     USERNAME        MODULE          XID              EVENT                           SWAIT OBJ                            SQL_ID        SQL_EXEC_START      SQL_EXEC_ID TOP_LEVEL_SQL
------------------- ---------- ------------ -------------- --------------- --------------- ---------------- ------------------------------ ------ ------------------------------ ------------- ------------------- ----------- -------------
2023-10-02 10:54:51          1 278          278,21981@1                                                     **INACTIVE**
                             2 +-1206       1206,8377@1    CLAROE          SQL*Plus        8B001500D5340000 enq: TX - row lock contention      31 CLAROE.T                       gj55cby0kzsdf 2023-10-02 10:54:11    16777228 gj55cby0kzsdf

                               SID
SAMPLE_TIME         LOCK_LEVEL QUEUE        SESSION_ID     USERNAME        MODULE          XID              EVENT                           SWAIT OBJ                            SQL_ID        SQL_EXEC_START      SQL_EXEC_ID TOP_LEVEL_SQL
------------------- ---------- ------------ -------------- --------------- --------------- ---------------- ------------------------------ ------ ------------------------------ ------------- ------------------- ----------- -------------
2023-10-02 10:55:02          1 278          278,21981@1                                                     **INACTIVE**
                             2 +-1206       1206,8377@1    CLAROE          SQL*Plus        8B001500D5340000 enq: TX - row lock contention      41 CLAROE.T                       gj55cby0kzsdf 2023-10-02 10:54:11    16777228 gj55cby0kzsdf
                             3   +-52       52,51865@1     CLAROE          SQL*Plus                         enq: TX - row lock contention       0 CLAROE.T                       2wsf2w5vst738 2023-10-02 10:54:56    16777221 2wsf2w5vst738
...
...

(NOTE: if the Session 3 does not appear in your result right away, just wait a little bit more for the information to be registered in the DBA_HIST view. You may need to wait some minutes for it to show up; other options would be changing the script to use V$ instead, or changing the _ash_size parameter at the instance level to force the ASH information to flush to disk faster).

So, the results show that until 10:54:51 (actually until some point between 10:54:51 and 10:55:02 which is the next captured sample), my Session 1 (SID 278) was INACTIVE and holding my Session 2 (SID 1206).

In the next sample time at 10:55:02, my Session 3 (SID 52) shows up also waiting for Session 2 (SID 1206), which is still waiting for Session 1 (SID 278). So, we have a queue of locks with three levels :-).

Conclusion

So, with this script you can clearly follow the timeline of occurrences in your database and track when the chain of issues started, and what was THE session or sessions that caused the initial issue, helping you identify root cause for tricky situations involving any type of lock.

If you didn’t yet, please read my previous post when I explain a real situation and how I was able to determine the root cause by using this script.

And that’s it for now. I hope you like it and it’s useful. If you happen to use this script and could solve important situations using it, please let me know. It would be great!!!

I would highly recommend you to also take a look at Tanel Poder’s script ash_wait_chains.sql here, where he shows chains of events that could also put some more light in difficult hanging situations.

Until next time!

ENQ: TM CONTENTION, NOT ALWAYS related to unindexed Foreign Keys. Or how ASH and a lot of tests saved the day again :-)

Hello, today I am going to present a very intricate case I faced in my client’s Production database that caused loss of important SLAs, why it happened, and how to reproduce it.

In August 1st, a lot of important batch jobs ended up locked and ran much longer than expected, causing a chain of delays and resulting in less of SLAs, and consequently a request for a deep analysis to fill an RCA 🙂 .

So, I first started my analysis using an AWR report, and determined that during that specific point in time, almost 50% of the DB Time was spent in “enq: TM – contention”:

This is very unusual and for sure it was the cause of the slowness.

If you research you will easily find a lot of posts and notes highlighting the main cause os this wait event: the lack of an index in a child table’s FOREIGN KEY column.

I then searched in ASH (Active Session History) for all the statements waiting in the TM enqueue wait and this is what I’ve found:

(NOTE: the SQL statements were edited to show only the relevant part and preserve privacy).

Wow, all DMLs against the same table PGM!!! There must be a missing index in one of the FKs pointing to this table!

It’s also worth noting that one of the statements is a SHRINK in a materialized view log table MLOG$_PGM, also related to PGM table. This was triggered by a MV refresh.

So, the next step would be easy, right? Just find what was the missing index, create it and problem solved.

Hmmmm, not that fast. There was no missing indexes in any of the foreign keys. I searched using several different scripts, provided by Oracle, my owns, others found in Internet. Nothing: all pointed no index was missing for FKs.

So, what the heck?

I read in details the Note 1905174.1, that mention not only the lack of indexes, but also other not so popular causes of the TM event, like concurrent parallel DMLS executions.

Well, none of the possible causes mentioned there matched our situation. We really had a lot of DMLs running against the table, but they were all running serially. No parallel execution at all. So what?

So, at this point I have to say: I opened an SR with Oracle, provided all the information requested, along with my opinions, executed and provided outputs for all that (sorry, Oracle Support) nonsense scripts they usually ask us to run (many clearly not related to the problem). After several days and even weeks of interaction, the SR was closed with a proposed solution simply stating that the high concurrency in DMLs on the table was the cause of the issue.

This was not good enough, at least for me, as an explanation. So I kept researching.

Long story short, I the started to leverage some of my “magic” (ok, not that much 🙂 ) scripts to search for locks in the ASH history, for that particular period. I have made a new version of the script, to show the locks in an hierarchical fashion, just like the old utllockt.sql used to show (I will post this script right away in a new post). Here is what I found:

The rows at the bottom, with a blue background, are the DML statements waiting on the TM contention event.

The row with a red background is the SHRINK statement on the MV log table. Its SQL_ID 0jqznbwhur0p9 is an ALTER TABLE MLOG$_PGM SHRINK SPACE, that was triggered by the top level SQL_ID auyucv2czxffz which is a procedure that runs the refresh of the MV.

The rows nor highlighted are row lock contentions, not related to the issue being investigated.

And, most importantly, we can see that the top row, with an yellow background, is the one that is locking all the others below!

I was able to determine again checking ASH that that session was running a transaction since 14:36:33 at least, so probably locking a lot of rows. And it had indeed INSERTED rows into one of the PGM child tables:

select sql_id, sql_text
from dba_hist_active_sess_history a
left join dba_hist_sqltext t using (DBID, SQL_ID) 
where snap_id between 68264 and 68265
and session_id=8359
and command_type != 3 --SELECT
and upper(sql_text) like '%PGM%';

SQL_ID        SQL_TEXT
------------- --------------------------------------------------------
5vdqb9jnwv0dm INSERT INTO PGM_ASSIGN ...

select xid, min(snap_id), min(sample_time)
from dba_hist_active_sess_history
where snap_id between 68000 and 68265
and xid = '1A040400D67B1300'
and session_id=8359
group by xid;

MIN(SNAP_ID) MIN(SAMPLE_TIME)
------------ -----------------
       68254 2023-08-01 14:36:33.173

Ok, so problem solved! It was that process at the top of the list, with module PB00M103, that was holding all the other sessions and caused the problem. RCA resolved!!! 🙂

But, wait! If there was no missing index on FK columns, no parallel DML execution, why in the world all that sessions (including that SHRINK on the MV log table) were waiting on enq: TM contention?

So, at this point if I was correct in my analysis, the following sequence of facts occurred:

  1. A transaction was ongoing that inserted rows into a child table (PGM_ASSIGN).
  2. Other transactions tried to modify rows into the parent table and got locked (enq: row lock contention).
  3. A MV refresh was issued, triggered a SHRINK in the MV log table, and was locked (enq: TM contention).

If I was correct, I could probably reproduce the steps with a test case, and maybe a new situation that causes the TM contention was discovered. At least for me, because I could not find any reference in the Internet, anywhere, pointing to that. If you can find something, please let me klnow.

So, I started to try create a test case that could reproduce the situation at will and proof my point.

After several tries and a lot of time, I finally was able to reproduce it with the steps I present here.

I was able to reproduce the issue both in 23c FREE and in 19c.

I am not saying that this is a bug, I guess this is probably expected behavior, but I could not find any documentation about it. I will open an SR to request it to be documented or a more detailed explanation.

So, first, lets create my objects and some fake data. Please notice that I am using some IF EXISTS and IF NOT EXISTS. If I’m nor wrong, this was implemented in 21c. So if you are using an older version, remove these clauses before running:

drop table if exists t_child;

Table dropped.

drop table if exists T;

Table dropped.

create table if NOT exists t nologging as
select level as ID, lpad('x',500,'x') as MYTEXT
from dual
connect by level <= 1000;

Table created.

alter table T add constraint PK_T primary key (id);

Table altered.

create table t_child
as select id from T where 1=2;

Table created.

alter table t_child add constraint FK_T foreign key (id) references T;

Table altered.

create index if not exists I_child_ID on t_child (id);

Index created.

create materialized view log on T with primary key;

Materialized view log created.

drop materialized view if exists mv_t;

Materialized view dropped.

create materialized view mv_t refresh fast as select * from t;

Materialized view created.

I also executed another statement, that allows ROW MOVEMENT on the MV log table. In my tests, without this it seems the SHRING is not triggered as part of the MV refresh, and so the situation I want to show does not happen:

alter table MLOG$_T enable row movement;

Table altered.

Now, we will need 5 sessions: 4 to have separate transactions running, and the 5th to monitor the others.

Session 1

In this session, I will intentionally execute and commit a first transaction just to have something created in the MV Log of my table T. In my tests, without this first transaction, the SHRINK triggered by the MVIEW refresh actually has nothing to do so it ends up not being locked as we want to see.

Then, I start a second transaction which inserts a row in the child table:

update T set mytext= lpad('y',500,'y') where id between 2 and 100;

99 rows updated.

commit;

Commit complete.

insert into T_child select id from T where id=1;

1 row created.

Session 2

Here in the Session 2, I will issue a DELETE against the parent table, for the same row that I inserted a child in Session 1.

This DELETE statement will be locked with enq: TX – row lock contention, because if the Session 1 commits the child record, this DELETE should result in a referential integrity error.

delete from T where id=1;
-- This will be locked

Monitoring Session

Let us see what is happening so far:

select sid, event, blocking_session, sql_id, sql_text
from v$session s join v$sqlarea a using (sql_id) 
where username=user and status='ACTIVE' and sid<>userenv('sid');

   SID EVENT                                    BLOCKING_SESSION SQL_ID        SQL_TEXT
------ ---------------------------------------- ---------------- ------------- ----------------------------------------------------------------
    51 enq: TX - row lock contention                         315 gq0nm7h7znaqg delete from T where id=1

1 row selected.

My Session 2 (SID 51) is locked by Session1 (SID 315), waiting on row lock contention.

Session 3

Now is the show time!

Let’s see if I can really reproduce the same situation, and have the MV refresh waiting on enq: TM contention.

Plase note, very important: the indexe I_CHILD_FK was created on T_CHILD.ID. So, my FK has a proper index!

alter table MLOG$_T shrink space;
-- This will be locked
-- You could also run: ALTER MATERIALIZED VIEW LOG ON t SHRINK SPACE;

Monitoring Session

Let’s see again what is happening:

select sid, event, blocking_session, sql_id, sql_text
from v$session s join v$sqlarea a using (sql_id) 
where username=user and status='ACTIVE' and sid<>userenv('sid');

   SID EVENT                                    BLOCKING_SESSION SQL_ID        SQL_TEXT
------ ---------------------------------------- ---------------- ------------- ----------------------------------------------------------------
    51 enq: TX - row lock contention                         315 gq0nm7h7znaqg delete from T where id=1
   299 enq: TM - contention                                   51 2tdwh27m73j2h alter table MLOG$_T shrink space

2 rows selected.

Now, we have my Session 3 (SID 299) locked by Session 2 (SID 51), WAITING ON THE ‘enq: TM – enqueue’ event.

Session 4

The worst part of the story happens NOW!

Since the MV Log table is locked for a SHRINK, all other DMLs against the main table WILL BE LOCKED as well, on enq: TM – contention.

Note below, I try to update a different row on T, but since this change must be logged in the MLOG$_T table for future refresh of the MV, and this MV log table is locked, my update will be locked. as well:

update T set mytext='a' where id=2;
-- This will be locked

Monitoring Session

Let’s see the final situation:

select sid, event, blocking_session, sql_id, sql_text
from v$session s join v$sqlarea a using (sql_id) 
where username=user and status='ACTIVE' and sid<>userenv('sid');

   SID EVENT                                    BLOCKING_SESSION SQL_ID        SQL_TEXT
------ ---------------------------------------- ---------------- ------------- ----------------------------------------------------------------
    51 enq: TX - row lock contention                         315 gq0nm7h7znaqg delete from T where id=1
   299 enq: TM - contention                                   51 2tdwh27m73j2h alter table MLOG$_T shrink space
   305 enq: TM - contention                                  299 9tx4g651scvud update T set mytext='a' where id=2

3 rows selected.

We can see that my Session 4 (SID 305) is locked by Session 3 (SID 299) also waiting on TM contention.

Conculsion

So, I was able to successfully reproduce the situation that I presented and happened in my client’s Production database.

A SHRINK SPACE on a MV log table, issued by the MV refresh, can wait on the TM enqueue event. And after that, all other sessions trying to DML on that table will be locked too.

The only piece that I could not reproduce 100% was calling the MV refresh and having it indirectly issuing the SHRINK. I know for a fact that this was the case, but unfortunately I got inconsistent results when trying to get it using my test case. I’m not sure if it’s some particular parameter of the MV or the MV log that would make it call the shrink when refreshing. I know there is a hidden parameter _mv_refresh_shrink_log that controls it, but both in my client’s Production and in my test environments it was set to TRUE, which is the default, so it was not it. That’s why in my test case I called the shrink directly instead.

If anybody can help me on that part, that would be very much appreciated.

And again, I could not find any mention to that situation anywhere online, even in MOS.

So, I hope this helps.

See you next time!!!

How to see locks from ASH the right way

Hello,

If you happen to have locks in your database and you want to see some more details on what sessions were blocking and blocked, even after the fact, you need to go to ASH (Active Session History) to look for the information.

As you may know, we have in V$SESSION information to identify the blocking session: the columns BLOCKING_SESSION, BLOCKING_SESSION_SERIAL# and BLOCKING_INSTANCE. And these values are persisted in ASH.

So, to see locks, initially you should just query DBA_HIST_ACTIVE_SESS_HISTORY (or GV$ACTIVE_SESSION_HISTORY) filtering rows that have non-null values in BLOCKING_SESSION. That would allow you to see all the details of the blocked session, as well as the SESSION_ID, SERIAL# and INSTANCE_NUMBER of the blocking session.

But, well, just knowing the session identified of the blocking session may not be enough to troubleshoot or understand who or what process was really blocking right?

So, here I present a script that will do a Self Join on ASH to get more information about the blocking sessions. I will show the USERNAME and MODULE of the blocking session, but of course you could change the script to show whatever other information you consider relevant.

But, there is another caveat: if I simply self join ASH with itself, trying to find the blocking session in the same SAMPLE_TIME that it was blocking the other session, I may end up not finding anything, because we need to remember, ASH only stores ACTIVE sessions, so if the blocking session is not active during that moment, it is simply not captured.

Because of that, the script I present here goes beyond, and extends the search for the blocking session to the entire time window being queried, as well as a defined time BEFORE the time window. This way we increase the chances of finding the blocking session’s relevant information.

I will post the code at the end of the post. The script accepts three parameters:

  • BEGIN DATE: the begin of the time window in which you want to search for locks. Please provide a date expression, like SYSDATE, or TO_DATE(). The default value is SYSDATE-1.
  • END_DATE: the end of the time window, using the same format. The default value is SYSDATE.
  • HOURS TO LOOK BACK: here is where the “magic” happens. You can provide a number of hours to look back, or -1 if you want to do the normal self join, matching the SAMPLE_TIME. The default is 1.

With the examples that I am going to provide below, I guess the differences of using the third parameter will become clear:

Using the “standard” self join (HOUR TO LOOK BACK = -1)

@blog_posts/ash_lock
BEGIN DATE [sysdate-1]:
END DATE   [sysdate]  :
HOURS TO LOOK BACK FOR BLOCKING SESSION INFO [1] (use -1 to match SAMPLE_TIME): -1

BLOCKING_SESSI BLOCKING_USER   BLOCKING_MODULE BLOCKED_SESSIO BLOCKED_USER    BLOCKED_MODULE  BLOCKED_SQLID BLOCKED_OBJECT                 EVENT                          WAIT_CLASS          QTY MIN_TIME            MAX_TIME            BLOCKING_LAST_ACTIVE
-------------- --------------- --------------- -------------- --------------- --------------- ------------- ------------------------------ ------------------------------ ------------ ---------- ------------------- ------------------- ------------------------------
   6218,680,@1 ***NOT FOUND*** ***NOT FOUND***   1436,1180,@1 PROD_BATCH      PO00C155        c5axukvtq2g8s ######.DOC#########            enq: TX - row lock contention  Application         139 2023-05-18 11:02:33 2023-05-18 12:25:57
               ***NOT FOUND*** ***NOT FOUND***   4974,7946,@1 PROD_GAGR       JDBC Thin Clien agt23pyt1dv9y ######.DOC#########            enq: TX - row lock contention  Application          12 2023-05-18 12:14:08 2023-05-18 12:17:03
               ***NOT FOUND*** ***NOT FOUND***   6665,4517,@1 PROD_GAGR       JDBC Thin Clien agt23pyt1dv9y ######.DOC#########            enq: TX - row lock contention  Application          11 2023-05-18 11:27:13 2023-05-18 11:47:56
               ***NOT FOUND*** ***NOT FOUND***   6918,8290,@1 PROD_GAGR       JDBC Thin Clien agt23pyt1dv9y ######.DOC#########            enq: TX - row lock contention  Application          36 2023-05-18 11:10:05 2023-05-18 12:25:06
               ***NOT FOUND*** ***NOT FOUND***   707,20598,@1 PROD_GAGR       JDBC Thin Clien agt23pyt1dv9y ######.DOC#########            enq: TX - row lock contention  Application          35 2023-05-18 11:18:08 2023-05-18 12:23:03

  2552,1032,@1 ***NOT FOUND*** ***NOT FOUND*** 11442,11610,@1 PROD_BATCH      PB######        dqn9wh1bg7phc ######.ED###########           enq: TX - row lock contention  Application           4 2023-05-18 10:23:41 2023-05-18 10:24:11

  294,12841,@1 PB########      PO#######         145,34728,@1 PROD_BATCH      PO#######       07t65g390u6yv ######.MED###################  enq: TX - row lock contention  Application           1 2023-05-17 17:34:59 2023-05-17 17:34:59
               PB########      PO#######        12729,4409,@1 PROD_BATCH      PO#######       07t65g390u6yv ######.MED###################  enq: TX - row lock contention  Application           1 2023-05-17 17:15:58 2023-05-17 17:15:58
               PB########      PO#######        6528,18277,@1 PROD_BATCH      PO#######       07t65g390u6yv ######.MED###################  enq: TX - row lock contention  Application           1 2023-05-17 17:15:58 2023-05-17 17:15:58
               PB########      PO#######        9309,49885,@1 PROD_BATCH      PO#######       07t65g390u6yv ######.MED###################  enq: TX - row lock contention  Application           1 2023-05-17 17:15:58 2023-05-17 17:15:58
               ***NOT FOUND*** ***NOT FOUND***  9611,29300,@1 PROD_BATCH      PO#######       07t65g390u6yv ######.MED###################  enq: TX - row lock contention  Application           1 2023-05-17 17:11:00 2023-05-17 17:11:00
               PB########      PO#######       11720,53125,@1 PROD_BATCH      PO#######       07t65g390u6yv ######.MED###################  enq: TX - row lock contention  Application           2 2023-05-17 17:15:58 2023-05-17 18:49:29
               ***NOT FOUND*** ***NOT FOUND*** 11720,53125,@1 PROD_BATCH      PO#######       07t65g390u6yv ######.MED###################  enq: TX - row lock contention  Application           1 2023-05-17 16:27:29 2023-05-17 16:27:29

 9888,36973,@1 ***NOT FOUND*** ***NOT FOUND*** 11564,19490,@1 PROD_BATCH      PI1#######      0cdaygdtzkktf ######.PG##############        enq: TX - row lock contention  Application           1 2023-05-17 22:31:09 2023-05-17 22:31:09

10039,46688,@1 ***NOT FOUND*** ***NOT FOUND*** 10871,25836,@1 PROD_ONLINE     JDBC Thin Clien abm00fdp5uxpu ######.CUS#####                enq: TX - row lock contention  Application           1 2023-05-17 15:23:14 2023-05-17 15:23:14


15 rows selected.

Note the ***NOT FOUND*** values in BLOCKING_USER and BLOCKING_MODULE. They are there because the script could not find the blocking session information on the same SAMPLE_TIME that the lock was occurring, meaning the blocking session was actually INACTIVE at that moment and thus it was not captured.

Also note there are two different rows with the same blocking session (294) and blocked session (11720). They were not grouped together because in two of the samples the blocking session was active, but not in the other one.

Searching for the blocking session anywhere in the time window (HOUR TO LOOK BACK = 0)

@blog_posts/ash_lock
BEGIN DATE [sysdate-1]:
END DATE   [sysdate]  :
HOURS TO LOOK BACK FOR BLOCKING SESSION INFO [1] (use -1 to match SAMPLE_TIME): 0

BLOCKING_SESSI BLOCKING_USER   BLOCKING_MODULE BLOCKED_SESSIO BLOCKED_USER    BLOCKED_MODULE  BLOCKED_SQLID BLOCKED_OBJECT                 EVENT                          WAIT_CLASS          QTY MIN_TIME            MAX_TIME            BLOCKING_LAST_ACTIVE
-------------- --------------- --------------- -------------- --------------- --------------- ------------- ------------------------------ ------------------------------ ------------ ---------- ------------------- ------------------- ------------------------------
   6218,680,@1 ***NOT FOUND*** ***NOT FOUND***   1436,1180,@1 PB########      PO0#####        c5axukvtq2g8s ######.DOC#########            enq: TX - row lock contention  Application         139 2023-05-18 11:02:33 2023-05-18 12:25:57
               ***NOT FOUND*** ***NOT FOUND***   4974,7946,@1 PG#######       JDBC Thin Clien agt23pyt1dv9y ######.DOC#########            enq: TX - row lock contention  Application          12 2023-05-18 12:14:08 2023-05-18 12:17:03
               ***NOT FOUND*** ***NOT FOUND***   6665,4517,@1 PG#######       JDBC Thin Clien agt23pyt1dv9y ######.DOC#########            enq: TX - row lock contention  Application          11 2023-05-18 11:27:13 2023-05-18 11:47:56
               ***NOT FOUND*** ***NOT FOUND***   6918,8290,@1 PG#######       JDBC Thin Clien agt23pyt1dv9y ######.DOC#########            enq: TX - row lock contention  Application          36 2023-05-18 11:10:05 2023-05-18 12:25:06
               ***NOT FOUND*** ***NOT FOUND***   707,20598,@1 PG#######       JDBC Thin Clien agt23pyt1dv9y ######.DOC#########            enq: TX - row lock contention  Application          35 2023-05-18 11:18:08 2023-05-18 12:23:03

  2552,1032,@1 PB########      PB######        11442,11610,@1 PB########      PB######        dqn9wh1bg7phc ######.ED###########           enq: TX - row lock contention  Application           4 2023-05-18 10:23:41 2023-05-18 10:24:11 2023-05-18 10:25:55.460

  294,12841,@1 PB########      PO#######         145,34728,@1 PB########      PO#######       07t65g390u6yv ######.MED###################  enq: TX - row lock contention  Application           1 2023-05-17 17:34:59 2023-05-17 17:34:59 2023-05-17 18:49:29.092
               PB########      PO#######        12729,4409,@1 PB########      PO#######       07t65g390u6yv ######.MED###################  enq: TX - row lock contention  Application           1 2023-05-17 17:15:58 2023-05-17 17:15:58 2023-05-17 18:49:29.092
               PB########      PO#######        6528,18277,@1 PB########      PO#######       07t65g390u6yv ######.MED###################  enq: TX - row lock contention  Application           1 2023-05-17 17:15:58 2023-05-17 17:15:58 2023-05-17 18:49:29.092
               PB########      PO#######        9309,49885,@1 PB########      PO#######       07t65g390u6yv ######.MED###################  enq: TX - row lock contention  Application           1 2023-05-17 17:15:58 2023-05-17 17:15:58 2023-05-17 18:49:29.092
               PB########      PO#######        9611,29300,@1 PB########      PO#######       07t65g390u6yv ######.MED###################  enq: TX - row lock contention  Application           1 2023-05-17 17:11:00 2023-05-17 17:11:00 2023-05-17 18:49:29.092
               PB########      PO#######       11720,53125,@1 PB########      PO#######       07t65g390u6yv ######.MED###################  enq: TX - row lock contention  Application           3 2023-05-17 16:27:29 2023-05-17 18:49:29 2023-05-17 18:49:29.092

 9888,36973,@1 ***NOT FOUND*** ***NOT FOUND*** 11564,19490,@1 PB########      PI1#######      0cdaygdtzkktf ######.PG##############        enq: TX - row lock contention  Application           1 2023-05-17 22:31:09 2023-05-17 22:31:09

10039,46688,@1 PO#########     JDBC Thin Clien 10871,25836,@1 PO#########     JDBC Thin Clien abm00fdp5uxpu ######.CUS#####                enq: TX - row lock contention  Application           1 2023-05-17 15:23:14 2023-05-17 15:23:14 2023-05-17 16:01:36.708


14 rows selected.

Note that now many of the ***NOT FOUND*** values are gone, meaning the script was able to find the blocking session in other samples inside the time window. Nonetheless, the blocking sessions 6218 and 9888 were still not found, meaning they were not ACTIVE in any of the samples captured inside the time window.

Also note that now there’s only one row for the blocking session 294 and blocked session 11720, which makes more sense since the sessions are the same. This was possible because the blocking session was search not only in the same sample, but the entire window, before the self join 😉 .

Searching for the blocking session anywhere even BEFORE the defined time window (HOUR TO LOOK BACK > 0)

@blog_posts/ash_lock
BEGIN DATE [sysdate-1]:
END DATE   [sysdate]  :
HOURS TO LOOK BACK FOR BLOCKING SESSION INFO [1] (use -1 to match SAMPLE_TIME): -24

BLOCKING_SESSI BLOCKING_USER   BLOCKING_MODULE BLOCKED_SESSIO BLOCKED_USER    BLOCKED_MODULE  BLOCKED_SQLID BLOCKED_OBJECT                 EVENT                          WAIT_CLASS          QTY MIN_TIME            MAX_TIME            BLOCKING_LAST_ACTIVE
-------------- --------------- --------------- -------------- --------------- --------------- ------------- ------------------------------ ------------------------------ ------------ ---------- ------------------- ------------------- ------------------------------
   6218,680,@1 PO#########     MODULE1           1436,1180,@1 PB########      PO0#####        c5axukvtq2g8s ######.DOC#########            enq: TX - row lock contention  Application         139 2023-05-18 11:02:33 2023-05-18 12:25:57
               PO#########     MODULE1           4974,7946,@1 PG#######       JDBC Thin Clien agt23pyt1dv9y ######.DOC#########            enq: TX - row lock contention  Application          12 2023-05-18 12:14:08 2023-05-18 12:17:03
               PO#########     MODULE1           6665,4517,@1 PG#######       JDBC Thin Clien agt23pyt1dv9y ######.DOC#########            enq: TX - row lock contention  Application          11 2023-05-18 11:27:13 2023-05-18 11:47:56
               PO#########     MODULE1           6918,8290,@1 PG#######       JDBC Thin Clien agt23pyt1dv9y ######.DOC#########            enq: TX - row lock contention  Application          36 2023-05-18 11:10:05 2023-05-18 12:25:06
               PO#########     MODULE1           707,20598,@1 PG#######       JDBC Thin Clien agt23pyt1dv9y ######.DOC#########            enq: TX - row lock contention  Application          35 2023-05-18 11:18:08 2023-05-18 12:23:03

  2552,1032,@1 PB########      PB######        11442,11610,@1 PB########      PB######        dqn9wh1bg7phc ######.ED###########           enq: TX - row lock contention  Application           4 2023-05-18 10:23:41 2023-05-18 10:24:11 2023-05-18 10:25:55.460

  294,12841,@1 PB########      PO#######         145,34728,@1 PB########      PO#######       07t65g390u6yv ######.MED###################  enq: TX - row lock contention  Application           1 2023-05-17 17:34:59 2023-05-17 17:34:59 2023-05-17 18:49:29.092
               PB########      PO#######        12729,4409,@1 PB########      PO#######       07t65g390u6yv ######.MED###################  enq: TX - row lock contention  Application           1 2023-05-17 17:15:58 2023-05-17 17:15:58 2023-05-17 18:49:29.092
               PB########      PO#######        6528,18277,@1 PB########      PO#######       07t65g390u6yv ######.MED###################  enq: TX - row lock contention  Application           1 2023-05-17 17:15:58 2023-05-17 17:15:58 2023-05-17 18:49:29.092
               PB########      PO#######        9309,49885,@1 PB########      PO#######       07t65g390u6yv ######.MED###################  enq: TX - row lock contention  Application           1 2023-05-17 17:15:58 2023-05-17 17:15:58 2023-05-17 18:49:29.092
               PB########      PO#######        9611,29300,@1 PB########      PO#######       07t65g390u6yv ######.MED###################  enq: TX - row lock contention  Application           1 2023-05-17 17:11:00 2023-05-17 17:11:00 2023-05-17 18:49:29.092
               PB########      PO#######       11720,53125,@1 PB########      PO#######       07t65g390u6yv ######.MED###################  enq: TX - row lock contention  Application           3 2023-05-17 16:27:29 2023-05-17 18:49:29 2023-05-17 18:49:29.092

 9888,36973,@1 ***NOT FOUND*** ***NOT FOUND*** 11564,19490,@1 PB########      PI1#######      0cdaygdtzkktf ######.PG##############        enq: TX - row lock contention  Application           1 2023-05-17 22:31:09 2023-05-17 22:31:09

10039,46688,@1 PO#########     JDBC Thin Clien 10871,25836,@1 PO#########     JDBC Thin Clien abm00fdp5uxpu ######.CUS#####                enq: TX - row lock contention  Application           1 2023-05-17 15:23:14 2023-05-17 15:23:14 2023-05-17 16:01:36.708


14 rows selected.

Wonderful. Now that the script could look back 24 hours before the defined time window, it was able to find information for the session 6218. The session 9888 was still not found, meaning it was not active in any of the captures since 24 hours before the defined time window. If I wanted to still try to find it, I would need to allow the script to search more backwards, of course limited to the information stored in ASH.

Note that now, for almost all the blocking sessions, the script could find and show the relevant information that would help me troubleshoot the locking issues.

Oh, I was almost forgetting: here is the script.

accept bd prompt "BEGIN DATE [sysdate-1]: " default "sysdate-1"
accept ed prompt "END DATE   [sysdate]  : " default "sysdate"
accept hb prompt "HOURS TO LOOK BACK FOR BLOCKING SESSION INFO [1] (use -1 to match SAMPLE_TIME): " default "1"

col BLOCKING_SESSION for a14
col BLOCKING_USER for a15 TRUNC
col BLOCKING_MODULE for a15 TRUNC
col BLOCKED_SESSION for a14
col BLOCKED_USER for a15 TRUNC
col BLOCKED_MODULE for a15 TRUNC
col BLOCKED_OBJECT for a30 TRUNC
col EVENT for a30 TRUNC
col WAIT_CLASS for a12 TRUNC
col BLOCKING_LAST_ACTIVE for a30
break on BLOCKING_SESSION skip 1

WITH
dbahist0 as (
	select /*+ MATERIALIZE PARALLEL(a 1) */
		SAMPLE_TIME, DBID, INSTANCE_NUMBER, SESSION_ID, SESSION_SERIAL#, USER_ID, MODULE,
		BLOCKING_SESSION, BLOCKING_SESSION_SERIAL#, BLOCKING_INST_ID, BLOCKING_SESSION_STATUS,
		CURRENT_OBJ#, SQL_ID, 
		nvl(a.EVENT,'On CPU') as EVENT,
		nvl(a.WAIT_CLASS,'On CPU') as WAIT_CLASS
	from DBA_HIST_ACTIVE_SESS_HISTORY a
	-- Looking back &hb hours before the time window to try finding blocking session info if they are INACTIVE when blocking
	where SAMPLE_TIME between &bd - &hb/24 and &ed
	and DBID = (select DBID from v$database)
),
dbahist as (
	select a.*
	from dbahist0 a
	-- Now refiltering the dates to keep only the real time window
	where SAMPLE_TIME between &bd and &ed
	-- Only blocked sessions
	and BLOCKING_SESSION is not null
	and BLOCKING_SESSION_STATUS = 'VALID'
	-- I only want to see events related to applications activity, like 'row lock contention', 
	--    but not instance-related, like 'latch free' or 'log file sync'. Remove if you want to see all.
	and wait_class = 'Application'
	-- I don't want to see activity from SYS. Remove if you want to see all.
	and user_id != 0
),
blocking as (
	select DBID, INSTANCE_NUMBER,
		SESSION_ID, SESSION_SERIAL#, USER_ID, max(MODULE) as MODULE, max(SAMPLE_TIME) LAST_ACTIVE
	from dbahist0 b
	group by DBID, INSTANCE_NUMBER, SESSION_ID, SESSION_SERIAL#, b.USER_ID
),
q as (
	select cast(a.SAMPLE_TIME as date) SAMPLE_TIME,
		lpad(a.BLOCKING_SESSION || ',' || a.BLOCKING_SESSION_SERIAL# || ',@' || a.BLOCKING_INST_ID, 14, ' ') as BLOCKING_SESSION,
		coalesce(blocking.MODULE,blocking2.MODULE) as BLOCKING_MODULE, 
		coalesce(blocking.USER_ID,blocking2.USER_ID) as BLOCKING_USER_ID, 
		lpad(a.SESSION_ID || ',' || a.SESSION_SERIAL# || ',@' || a.INSTANCE_NUMBER, 14, ' ') as BLOCKED_SESSION, 
		a.MODULE as BLOCKED_MODULE, a.USER_ID as BLOCKED_USER_ID, a.CURRENT_OBJ#,
		a.SQL_ID as BLOCKED_SQLID, a.EVENT, a.WAIT_CLASS, blocking.LAST_ACTIVE
 	from dbahist a
	left join blocking
		on '&hb' != '-1'
		and a.DBID = blocking.DBID
		and a.BLOCKING_INST_ID = blocking.INSTANCE_NUMBER
		and a.BLOCKING_SESSION = blocking.SESSION_ID
		and a.BLOCKING_SESSION_SERIAL# = blocking.SESSION_SERIAL#
	left join dbahist0 blocking2
		on '&hb' = '-1'
		and a.DBID = blocking2.DBID
		and a.BLOCKING_INST_ID = blocking2.INSTANCE_NUMBER
		and a.BLOCKING_SESSION = blocking2.SESSION_ID
		and a.BLOCKING_SESSION_SERIAL# = blocking2.SESSION_SERIAL#
		and a.SAMPLE_TIME = blocking2.SAMPLE_TIME
)
select
	BLOCKING_SESSION, nvl(ub.USERNAME,'***NOT FOUND***') as BLOCKING_USER, nvl(BLOCKING_MODULE,'***NOT FOUND***') as BLOCKING_MODULE, 
	BLOCKED_SESSION, u.USERNAME as BLOCKED_USER, BLOCKED_MODULE, BLOCKED_SQLID, 
	o.OWNER || '.' || o.OBJECT_NAME as BLOCKED_OBJECT,
	EVENT, WAIT_CLASS,
	count(1) QTY, min(SAMPLE_TIME) MIN_TIME, max(SAMPLE_TIME) MAX_TIME, LAST_ACTIVE as BLOCKING_LAST_ACTIVE
from q
left join dba_users u on u.USER_ID = q.BLOCKED_USER_ID
left join dba_users ub on ub.USER_ID = q.BLOCKING_USER_ID
left join dba_objects o on o.OBJECT_ID = q.CURRENT_OBJ#
group by 
	BLOCKING_SESSION, ub.USERNAME, BLOCKING_MODULE, LAST_ACTIVE,
	BLOCKED_SESSION, u.USERNAME, BLOCKED_MODULE,
	BLOCKED_SQLID, o.OWNER, o.OBJECT_NAME, EVENT, WAIT_CLASS
order by BLOCKING_SESSION, BLOCKED_SESSION 
/

That’s it for now. I hope you can find it useful!

Here are some final comments about the script:

  • The DBA_HIST_ACTIVE_SESS_HISTORY view is based on the table WRH$_ACTIVE_SESSION_HISTORY that is partitioned by ranges of DBID, SNAP_ID. So, the more you restrict your time window (which you translate into a range of SNAP_IDs), the more Oracle will be able to narrow the partitions to search into, speeding up the query.
  • In case you want to search a wide time window, I included a PARALLEL hint but put value 1. You can change it to a higher degree to speed up the query, but remember you can impact the performance of your system if you abuse of the resource.
  • I included filters to not show SYS sessions blocking others (usually in events like ‘log file sync’ and other instance activities) and to only show the Application wait class, because I am more interested in events like ‘row lock contention’, but not others like ‘read by other session’ that are concurrency-related. Of course, you can remove these filters if you want.
  • Do NOT think the total time between MIN_TIME and MAX_TIME means the session was blocked that entire time. Remember ASH persists one “screenshot” of only ACTIVE sessions every 10 seconds by default. So, you may have a session that for example was locked by another in two different moments (samples) but not in others, during a period of time. The QTY shows you how many times that particular sessions were captured blocking/blocked.

See you soon!

Two indexes with the same columns, NUM_DISTINCT different = performance issues

These days I’ve been facing a tricky performance issue in a client, related to SQL performance.

The basics of the problem: a simple query joining two tables, with filters on only one of them, picking the wrong index.

During my analysis, I was able to narrow the scope and get the same issue by only using the filtered table. So I will explain my case using this simplified query version.

But first an important disclaimer: up to this moment, I was NOT able to create a reproducible test-case with a fake table and fake data. So I will continue explaining the situation with the real application tables, but unfortunately you won’t be able to reproduce the situation in your environment.

You will see during this post what exactly I was not able to reproduce. If you can find a way to do that, please let me know, it would be very much appreciated!

If I manage to create the reproducible test case, or someone help me with that, I will come back and update this post.

I guess Jonathan Lewis and Richard Foote would be two perfect guys to figure this out. JL and Rich, are you there? HEEEEELP 🙂

So, here is my simplified version of the problematic query:

set feedback only
select * from issuance 
where "ISSUANCE"."EFF_DATE">=to_date('07/01/2021','mm/dd/yyyy')
and "ISSUANCE"."EFF_DATE"<=to_date('04/30/2023','mm/dd/yyyy')
and pgm_id=824727031;

40 rows selected.

set feedback on
select * from table(dbms_xplan.display_cursor());

PLAN_TABLE_OUTPUT
------------------------------------------------------------------------------------------------------------------------------
SQL_ID  87q709ac0h055, child number 0
-------------------------------------
select * from issuance where "ISSUANCE"."EFF_DATE">=to_date('07/01/2021'
,'mm/dd/yyyy') and "ISSUANCE"."EFF_DATE"<=to_date('04/30/2023','mm/dd/yy
yy') and pgm_id=824727031

Plan hash value: 589128554

------------------------------------------------------------------------------------------------------------------------------
| Id  | Operation                                  | Name            | Rows  | Bytes | Cost (%CPU)| Time     | Pstart| Pstop |
------------------------------------------------------------------------------------------------------------------------------
|   0 | SELECT STATEMENT                           |                 |       |       |    12 (100)|          |       |       |
|   1 |  TABLE ACCESS BY GLOBAL INDEX ROWID BATCHED| ISSUANCE        |     7 |  1666 |    12   (0)| 00:00:01 | ROWID | ROWID |
|*  2 |   INDEX RANGE SCAN                         | ISSUANCE_7S_IDX |     7 |       |     4   (0)| 00:00:01 |       |       |
------------------------------------------------------------------------------------------------------------------------------

Predicate Information (identified by operation id):
---------------------------------------------------

   2 - access("PGM_ID"=824727031 AND "ISSUANCE"."EFF_DATE">=TO_DATE(' 2021-07-01 00:00:00', 'syyyy-mm-dd hh24:mi:ss')
              AND "ISSUANCE"."EFF_DATE"<=TO_DATE(' 2023-04-30 00:00:00', 'syyyy-mm-dd hh24:mi:ss'))


22 rows selected.

Let’s take a look at two indexes of interest:

col index_name for a20
col columns for a20
col index_type for a12
def owner='XXX' --hiding the real schema name for privacy

select 
	i.index_name, listagg(column_name,', ') columns, index_type, status, 
	visibility, uniqueness, partitioned, num_rows, distinct_keys
from dba_indexes i 
join dba_ind_columns c 
on i.owner = c.index_owner and i.index_name = c.index_name
where owner='&owner' 
and i.table_name='ISSUANCE'
and i.index_name in ('ISSUANCE_7S_IDX','ISSUANCE_11S_IDX')
group by 
	i.index_name, index_type, status, 
	visibility, uniqueness, partitioned, num_rows, distinct_keys
/

INDEX_NAME           COLUMNS              INDEX_TYPE   STATUS   VISIBILIT UNIQUENES PAR   NUM_ROWS DISTINCT_KEYS
-------------------- -------------------- ------------ -------- --------- --------- --- ---------- -------------
ISSUANCE_7S_IDX      PGM_ID, EFF_DATE     NORMAL       VALID    VISIBLE   NONUNIQUE NO   533023627     399300657
ISSUANCE_11S_IDX     EFF_DATE, PGM_ID     NORMAL       VALID    VISIBLE   NONUNIQUE NO   533023627     401478525

2 rows selected.

I’m showing abobe the two indexes of interest for this case: ISSUANCE_7S_IDX and ISSUANCE_11S_IDX.

Yes, you saw right. Both indexes have the same columns, but in a different order!

Maybe if you have sharp eyes (paraphrasing Richard Foote), you may have seen something “interesting” in the output above. Keep reading 😉 .

It’s out of the scope here to discuss why those indexes are there. To be honest, I didn’t even know it was possible to have two indexes on the same columns, without any difference in type or structure, just the column order. I remember it wasn’t allowed in older versions of Oracle. By the way, I’m using Oracle 19 here.

So, looking for the query, we can see that both columns are being filtered, making both indexes feasible for the Optimizer to use in the execution plan.

Remembering the rules of thumb to create indexes, we could expect that the preferable index would be the one with the most selective column first. Let’s take a look:

col column_name for a20
select column_name, num_distinct, num_nulls, histogram
from dba_tab_columns
where owner='&owner'
and table_name='ISSUANCE'
and column_name in ('PGM_ID','EFF_DATE');

COLUMN_NAME          NUM_DISTINCT  NUM_NULLS HISTOGRAM
-------------------- ------------ ---------- ---------------
EFF_DATE                     9512          0 HYBRID
PGM_ID                   12304384     420187 NONE

PGM_ID has much more distinct values, so it is more selective than EFF_DATE. Then, the preferable index would be ISSUANCE_7S_IDX, so the plan showed before was picking the right one.

But, check out what happens if I change the predicates a little bit, just choosing a smaller date range and a different ID (just to bring at least one row):

set feedback only
select * from issuance 
where "ISSUANCE"."EFF_DATE">=to_date('04/01/2023','mm/dd/yyyy')
and "ISSUANCE"."EFF_DATE"<=to_date('04/30/2023','mm/dd/yyyy')
and pgm_id=4006035002;

1 row selected.

set feedback on
select * from table(dbms_xplan.display_cursor());

PLAN_TABLE_OUTPUT
--------------------------------------------------------------------------------------------------------------------------------
SQL_ID  9hs1nkwn4wusf, child number 0
-------------------------------------
select * from issuance where "ISSUANCE"."EFF_DATE">=to_date('04/01/2023'
,'mm/dd/yyyy') and "ISSUANCE"."EFF_DATE"<=to_date('04/30/2023','mm/dd/yy
yy') and pgm_id=4006035002

Plan hash value: 2173181032

-------------------------------------------------------------------------------------------------------------------------------
| Id  | Operation                                  | Name             | Rows  | Bytes | Cost (%CPU)| Time     | Pstart| Pstop |
-------------------------------------------------------------------------------------------------------------------------------
|   0 | SELECT STATEMENT                           |                  |       |       |     3 (100)|          |       |       |
|   1 |  TABLE ACCESS BY GLOBAL INDEX ROWID BATCHED| ISSUANCE         |     1 |   238 |     3   (0)| 00:00:01 | ROWID | ROWID |
|*  2 |   INDEX RANGE SCAN                         | ISSUANCE_11S_IDX |     1 |       |     3   (0)| 00:00:01 |       |       |
-------------------------------------------------------------------------------------------------------------------------------

Predicate Information (identified by operation id):
---------------------------------------------------

   2 - access("ISSUANCE"."EFF_DATE">=TO_DATE(' 2023-04-01 00:00:00', 'syyyy-mm-dd hh24:mi:ss') AND "PGM_ID"=4006035002
              AND "ISSUANCE"."EFF_DATE"<=TO_DATE(' 2023-04-30 00:00:00', 'syyyy-mm-dd hh24:mi:ss'))
       filter("PGM_ID"=4006035002)


23 rows selected.

Note that in this case, the Optimizer picked the other index, 11S, which have EFF_DATE first. Would it be that because of the smaller date range, EFF_DATE is now more selective? Let’s check:

explain plan for 
select * from issuance 
where "ISSUANCE"."EFF_DATE">=to_date('04/01/2023','mm/dd/yyyy')
and "ISSUANCE"."EFF_DATE"<=to_date('04/30/2023','mm/dd/yyyy');

Explained.

select * from table(dbms_xplan.display());

PLAN_TABLE_OUTPUT
--------------------------------------------------------------------------------------------------------------------------------
Plan hash value: 764907977

--------------------------------------------------------------------------------------------------------------------------------
| Id  | Operation                                  | Name             | E-Rows |E-Bytes| Cost (%CPU)| E-Time   | Pstart| Pstop |
--------------------------------------------------------------------------------------------------------------------------------
|   0 | SELECT STATEMENT                           |                  |  21942 |  5099K|     3   (0)| 00:00:01 |       |       |
|   1 |  TABLE ACCESS BY GLOBAL INDEX ROWID BATCHED| ISSUANCE         |  21942 |  5099K|     3   (0)| 00:00:01 | ROWID | ROWID |
|*  2 |   INDEX RANGE SCAN                         | ISSUANCE_10S_IDX |      1 |       |     3   (0)| 00:00:01 |       |       |
--------------------------------------------------------------------------------------------------------------------------------

Predicate Information (identified by operation id):
---------------------------------------------------

   2 - access("ISSUANCE"."EFF_DATE">=TO_DATE(' 2023-04-01 00:00:00', 'syyyy-mm-dd hh24:mi:ss') AND
              "ISSUANCE"."EFF_DATE"<=TO_DATE(' 2023-04-30 00:00:00', 'syyyy-mm-dd hh24:mi:ss'))
       filter(TRUNC(INTERNAL_FUNCTION("EFF_DATE"),'fmmon')>=TRUNC(TO_DATE(' 2023-04-01 00:00:00', 'syyyy-mm-dd
              hh24:mi:ss'),'fmmon') AND TRUNC(INTERNAL_FUNCTION("EFF_DATE"),'fmmon')<=TRUNC(TO_DATE(' 2023-04-30 00:00:00',
              'syyyy-mm-dd hh24:mi:ss'),'fmmon'))

Note
-----
   - Warning: basic plan statistics not available. These are only collected when:
       * hint 'gather_plan_statistics' is used for the statement or
       * parameter 'statistics_level' is set to 'ALL', at session or system level

24 rows selected.

explain plan for select * from issuance where pgm_id=4006035002;

Explained.

select * from table(dbms_xplan.display());

PLAN_TABLE_OUTPUT
-------------------------------------------------------------------------------------------------------------------------------
Plan hash value: 589128554

-------------------------------------------------------------------------------------------------------------------------------
| Id  | Operation                                  | Name            | E-Rows |E-Bytes| Cost (%CPU)| E-Time   | Pstart| Pstop |
-------------------------------------------------------------------------------------------------------------------------------
|   0 | SELECT STATEMENT                           |                 |     43 | 10191 |    47   (0)| 00:00:01 |       |       |
|   1 |  TABLE ACCESS BY GLOBAL INDEX ROWID BATCHED| ISSUANCE        |     43 | 10191 |    47   (0)| 00:00:01 | ROWID | ROWID |
|*  2 |   INDEX RANGE SCAN                         | ISSUANCE_7S_IDX |     43 |       |     4   (0)| 00:00:01 |       |       |
-------------------------------------------------------------------------------------------------------------------------------

Predicate Information (identified by operation id):
---------------------------------------------------

   2 - access("PGM_ID"=4006035002)

Note
-----
   - Warning: basic plan statistics not available. These are only collected when:
       * hint 'gather_plan_statistics' is used for the statement or
       * parameter 'statistics_level' is set to 'ALL', at session or system level

20 rows selected.

Don’t pay attention to the indexes picked above, just the predicted cardinality of the queries: by filtering only EFF_DATE, I would get about 22k rows, and only 43 by filtering PGM_ID. So, PGM_ID is the most selective, and index 7S would be preferable according to the rule of thumb.

Please note that both indexes would have the same cost to be accessed, since the columns are the same. Let’s confirm that as well:

explain plan for 
select /*+ index(ISSUANCE ISSUANCE_7S_IDX) */ * from issuance 
where "ISSUANCE"."EFF_DATE">=to_date('04/01/2023','mm/dd/yyyy')
and "ISSUANCE"."EFF_DATE"<=to_date('04/30/2023','mm/dd/yyyy')
and pgm_id=4006035002;

Explained.

select * from table(dbms_xplan.display());

PLAN_TABLE_OUTPUT
------------------------------------------------------------------------------------------------------------------------------
Plan hash value: 589128554

------------------------------------------------------------------------------------------------------------------------------
| Id  | Operation                                  | Name            | Rows  | Bytes | Cost (%CPU)| Time     | Pstart| Pstop |
------------------------------------------------------------------------------------------------------------------------------
|   0 | SELECT STATEMENT                           |                 |     1 |   238 |     3   (0)| 00:00:01 |       |       |
|   1 |  TABLE ACCESS BY GLOBAL INDEX ROWID BATCHED| ISSUANCE        |     1 |   238 |     3   (0)| 00:00:01 | ROWID | ROWID |
|*  2 |   INDEX RANGE SCAN                         | ISSUANCE_7S_IDX |     1 |       |     3   (0)| 00:00:01 |       |       |
------------------------------------------------------------------------------------------------------------------------------

Predicate Information (identified by operation id):
---------------------------------------------------

   2 - access("PGM_ID"=4006035002 AND "ISSUANCE"."EFF_DATE">=TO_DATE(' 2023-04-01 00:00:00', 'syyyy-mm-dd
              hh24:mi:ss') AND "ISSUANCE"."EFF_DATE"<=TO_DATE(' 2023-04-30 00:00:00', 'syyyy-mm-dd hh24:mi:ss'))
       filter(TRUNC(INTERNAL_FUNCTION("EFF_DATE"),'fmmon')>=TRUNC(TO_DATE(' 2023-04-01 00:00:00', 'syyyy-mm-dd
              hh24:mi:ss'),'fmmon') AND TRUNC(INTERNAL_FUNCTION("EFF_DATE"),'fmmon')<=TRUNC(TO_DATE(' 2023-04-30 00:00:00',
              'syyyy-mm-dd hh24:mi:ss'),'fmmon'))

18 rows selected.

As expected. the exact same cost of 3 either using index 7S or 11S. So, how the Optimizer chose one rather than the other?

This is the question that originated this post in the first place.

So, I ended up having to extract Trace 10053 for the queries, to understand how the Optimizer was choosing the index to use. Here are the parts of interest for that trace:

 ****** Costing Index ISSUANCE_11S_IDX
...
  Access Path: index (RangeScan)
    Index: ISSUANCE_11S_IDX
    resc_io: 3.000000  resc_cpu: 21564
    ix_sel: 0.000000  ix_sel_with_filters: 0.000000
    Cost: 3.000942  Resp: 3.000942  Degree: 1
...
 ****** Costing Index ISSUANCE_7S_IDX
...
  Access Path: index (RangeScan)
    Index: ISSUANCE_7S_IDX
    resc_io: 3.000000  resc_cpu: 21564
    ix_sel: 0.000000  ix_sel_with_filters: 0.000000
    Cost: 3.000942  Resp: 3.000942  Degree: 1
...
  ****** trying bitmap/domain indexes ******
  ****** finished trying bitmap/domain indexes ******
  Best:: AccessPath: IndexRange
  Index: ISSUANCE_11S_IDX
         Cost: 3.000942  Degree: 1  Resp: 3.000942  Card: 0.001782  Bytes: 0.000000

So, we can confirm in the trace that both indexes had the cost calculated as 3. But there is no clue in the trace why one was picked instead of the other.

Then, I found this. In the first comment, Jonathan Lewis states the following: “If all indexes are non-unique and the costs are the same then tie-break on number of distinct keys, if those match then alphabetical”. Its 2014, older versions of Oracle, but worth checking if this is still accurate.

The statement seems to match our situation. Both indexes are non-unique, we have a tie in the cost, so if that is right Oracle would be choosing the index with the higher number of distinct keys, and if still tied, by alphabetical order.

That’s why I said in the beginning that maybe you with sharp eyes could have noticed something weird: both indexes have the same columns, so of course they would have the exact same number of distinct keys, right? Well, yes and no!

YES, the REAL number of distinct keys for both indexes must be the same since the columns are the same, just a different order.

BUT, I noticed that in my case the numbers gathered by statistics simply don’t match:

select index_name, num_rows, distinct_keys
from dba_indexes
where index_name in ('ISSUANCE_7S_IDX','ISSUANCE_11S_IDX');

INDEX_NAME                            NUM_ROWS DISTINCT_KEYS
----------------------------------- ---------- -------------
ISSUANCE_7S_IDX                      533023627     399300657
ISSUANCE_11S_IDX                     533023627     401478525

2 rows selected.

See? The number of distinct values are different. And the index with the higher value between them is ISSUANCE_11S_IDX. So, it seems to explain why the Optimizer is choosing index 11S instead of 7S.

But, the other question that arises is: WHY THE HELL are these number of distinct keys different?

Then, I remembered another important thing: we gather stats on our tables following Oracle’s recommendation to use AUTO_SAMPLE_SIZE. And, since Oracle 12c, the AUTO_SAMPLE_SIZE was modified and use algorithms to get APPROXIMATE values for the number of distinct values! This change was implemented to save CPU and improve gather stats times by not having to do lots of COUNT(DISTINCT) for each column of the table.

I enabled trace in my session and re-gathered stats on the table. Check out what statement Oracle is running to gather the stats:

select 
  /*+ opt_param('_optimizer_use_auto_indexes' 'on')   no_parallel_index(t, "ISSUANCE_7S_IDX")  dbms_stats cursor_sharing_exact use_weak_name_resl dynamic_sampling(0) no_monitoring xmlindex_sel_idx_tbl opt_param('optimizer_inmemory_aware' 'false') no_substrb_pad  no_expand
  index_ffs(t,"ISSUANCE_7S_IDX") */
  count(*) as nrw, 
  approx_count_distinct(
    sys_op_lbid(4352685, 'L', t.rowid)
  ) as nlb, 
  approx_count_distinct(
    sys_op_combined_hash("PGM_ID", "EFF_DATE")
  ) as ndk, 
  sys_op_countchg(
    substrb(t.rowid, 1, 15), 
    1
  ) as clf 
from 
  "xxx"."ISSUANCE" t 
where 
  "PGM_ID" is not null 
  or "EFF_DATE" is not null

It uses the function APPROX_COUNT_DISTINCT to get NLB (number of leaf blocks) and NDK (number of distinct keys).

So, we are finally there. Let me summarize what I have learned:

  • You can have indexes with the same type, structure, etc, and same columns, just in different order. I’m not saying you must (it would be more like the opposite), but you can.
  • When the cost of different indexes are the same, and they are both unique on non-unique, then the Optimizer will pick the one with a high number of distinct keys. If the tie persists, then the name of the index determines the choice (alphabetical).
  • The gather stats with AUTO_SAMPLE_SIZE uses an internal algorithm to estimate with high accuracy the number of distinct keys, but it’s not 100% accurate.
  • In weird situations (like mine), even indexes with the same columns (and consequently the same REAL number of distinct values) will end up with the estimated number of distinct keys different, and this can lead to a bad execution plan choice.

To finish, I repeat that unfortunately I was not able to create a reproducible test case, with a fake table and fake data that after gathering stats on two indexes with the same columns would bring different estimated distinct values.

I would love to get help in creating this test case. And I also would love to get feedback and start a good discussion about it.

That’s it. I hope you have enjoyed the reading and learned something new, just like me.

See you soon!

NUM_ROWS=0 in DBA_INDEXES for a Partitioned Index?

These days a client I support had severe performance issues in a lower environment that, after some investigation, we determined were caused by some indexes with wrong statistics. Consequently, bad plans were being generated and caused the performance degradation.

There is a process we run to mask sensitive data in lower environments. This is a long, complex process that involves a lot of phases, and in order to speed up some phases of this process, indexes are put in UNUSABLE state during the data changes and movements, and rebuilt afterwards.

During the execution of this masking process weeks ago, a problem occurred with the script and some of the local partitioned indexes ended up not being rebuilt, so they were still as UNUSABLE.

Somebody from the team detected the problem later and rebuilt all the UNUSABLE partitioned indexes (it must be done by partition, it’s not possible to rebuild partitioned indexes as a whole).

But, even after the rebuild, people testing the application continued complaining about poor performance and we found that it was being caused by that indexes that had UNUSED partitions. Even after rebuilding the partitions, the statistics at the index level were still wrong, causing the performance problems.

I know, long explanation, hard to figure out. So I’ve created a test case to reproduce the issue at will and to better understand it.

First, I will create a partitioned table with some data, a local partitioned index, and gather stats:

create table t1
partition by range (category)
(
partition p1 values less than (3),
partition p2 values less than (6),
partition p3 values less than (MAXVALUE)
) as
select rownum as ID, case when rownum <= 6 then rownum else 99 end as CATEGORY, lpad('X',1000,'X') as NAME
from dual connect by level <= 50000;

Table created.

create index i1 on t1 (category) local;

Index created.

exec dbms_stats.gather_table_stats(user,'T1',cascade=>TRUE)

PL/SQL procedure successfully completed.

Here is the data generated and the stats for the index and its partitions:

select category, count(1) from t1 group by category order by 1;

  CATEGORY   COUNT(1)
---------- ----------
         1          1
         2          1
         3          1
         4          1
         5          1
         6          1
        99      49994

7 rows selected.

INDEX_NAME                          PARTITION_NAME       STATUS     NUM_ROWS LAST_ANALYZED
----------------------------------- -------------------- -------- ---------- -------------------
I1                                                       N/A           50000 2023-04-19 17:23:18
I1                                  P1                   USABLE            2 2023-04-19 17:23:18
I1                                  P2                   USABLE            3 2023-04-19 17:23:18
I1                                  P3                   USABLE        49995 2023-04-19 17:23:18

4 rows selected.

Please note that N/A in the STATUS simply means that the index is partitioned, so the status that counts is at the partition level.

Since the data I’ve create is skewed, different predicates for CATEGORY would generate different execution plans:

set feedback only
select * from t1 where category = 1;

1 row selected.

set feedback off
select * from table(dbms_xplan.display_cursor(null,null,'basic'));

PLAN_TABLE_OUTPUT
--------------------------------------------------------------------------------
EXPLAINED SQL STATEMENT:
------------------------
select * from t1 where category = 1

Plan hash value: 3860318639

-----------------------------------------------------------
| Id  | Operation                                  | Name |
-----------------------------------------------------------
|   0 | SELECT STATEMENT                           |      |
|   1 |  PARTITION RANGE SINGLE                    |      |
|   2 |   TABLE ACCESS BY LOCAL INDEX ROWID BATCHED| T1   |
|   3 |    INDEX RANGE SCAN                        | I1   |
-----------------------------------------------------------

set feedback only
select * from t1 where category = 99;

49994 rows selected.

set feedback on
select * from table(dbms_xplan.display_cursor(null,null,'basic'));

PLAN_TABLE_OUTPUT
--------------------------------------------------------------------------------
EXPLAINED SQL STATEMENT:
------------------------
select * from t1 where category = 99

Plan hash value: 1737577267

---------------------------------------
| Id  | Operation              | Name |
---------------------------------------
|   0 | SELECT STATEMENT       |      |
|   1 |  PARTITION RANGE SINGLE|      |
|   2 |   TABLE ACCESS FULL    | T1   |
---------------------------------------

set feedback only
select * from t1 where category <= 100;

50000 rows selected.

set feedback on
select * from table(dbms_xplan.display_cursor(null,null,'basic'));

PLAN_TABLE_OUTPUT
--------------------------------------------------------------------------------
EXPLAINED SQL STATEMENT:
------------------------
select * from t1 where category <= 100

Plan hash value: 589593414

------------------------------------
| Id  | Operation           | Name |
------------------------------------
|   0 | SELECT STATEMENT    |      |
|   1 |  PARTITION RANGE ALL|      |
|   2 |   TABLE ACCESS FULL | T1   |
------------------------------------

Now the fun begins :-). I will simulate what that masking process does in order to reproduce the issue.

First, I will make the index UNUSABLE. This is a very common step to speed up processes that make bulk data loads or changes. It’s much faster just do all the data changes and rebuild the index at the end than letting Oracle maintain the index for every single change we are doing.

alter index i1 unusable;

Index altered.

select index_name, partition_name, status, num_rows, last_analyzed from user_ind_partitions where index_name='I1'
UNION ALL
select index_name, NULL partition_name, status, num_rows, last_analyzed from user_indexes where index_name='I1'
order by 2 nulls first;

INDEX_NAME                          PARTITION_NAME       STATUS     NUM_ROWS LAST_ANALYZED
----------------------------------- -------------------- -------- ---------- -------------------
I1                                                       N/A           50000 2023-04-19 17:23:18
I1                                  P1                   UNUSABLE          2 2023-04-19 17:23:18
I1                                  P2                   UNUSABLE          3 2023-04-19 17:23:18
I1                                  P3                   UNUSABLE      49995 2023-04-19 17:23:18

4 rows selected.

Note that the status of the index partitions changed to UNUSED, but the index’s remains as N/A.

Now I will simulate data changes (the “masking” process):

alter table t1 enable row movement;

Table altered.

update t1 set id = 1000000-id;

50000 rows updated.

commit;

Commit complete.

I had to enable row movement for the table because the update I executed move rows among partitions.

Now, instead of rebuilding the UNUSABLE partitions before, I will “forget” this step and just gather new statistics for the index:

exec dbms_stats.gather_index_stats(user,'I1')

PL/SQL procedure successfully completed.

select index_name, partition_name, status, num_rows, last_analyzed from user_ind_partitions where index_name='I1'
UNION ALL
select index_name, NULL partition_name, status, num_rows, last_analyzed from user_indexes where index_name='I1'
order by 2 nulls first;

INDEX_NAME                          PARTITION_NAME       STATUS     NUM_ROWS LAST_ANALYZED
----------------------------------- -------------------- -------- ---------- -------------------
I1                                                       N/A               0 2023-04-19 17:28:53
I1                                  P1                   UNUSABLE          0 2023-04-19 17:28:53
I1                                  P2                   UNUSABLE          0 2023-04-19 17:28:53
I1                                  P3                   UNUSABLE          0 2023-04-19 17:28:53

4 rows selected.

Note that the NUM_ROWS both at the partitions and the index level are all 0.

I am not showing here, but all other statistics-related columns are with 0 as well.

I would guess Oracle should let these columns as NULL, since having 0 there can be kind of misleading. Let me know if you agree or disagree.

Let’s see how it impacts the execution plans:

set feedback only
select * from t1 where category = 1;

1 row selected.

set feedback on
select * from table(dbms_xplan.display_cursor(null,null,'basic'));

PLAN_TABLE_OUTPUT
----------------------------------------------------------------------------------------------------
EXPLAINED SQL STATEMENT:
------------------------
select * from t1 where category = 1

Plan hash value: 1737577267

---------------------------------------
| Id  | Operation              | Name |
---------------------------------------
|   0 | SELECT STATEMENT       |      |
|   1 |  PARTITION RANGE SINGLE|      |
|   2 |   TABLE ACCESS FULL    | T1   |
---------------------------------------


14 rows selected.

set feedback only
select * from t1 where category = 99;

49994 rows selected.

set feedback on
select * from table(dbms_xplan.display_cursor(null,null,'basic'));

PLAN_TABLE_OUTPUT
----------------------------------------------------------------------------------------------------
EXPLAINED SQL STATEMENT:
------------------------
select * from t1 where category = 99

Plan hash value: 1737577267

---------------------------------------
| Id  | Operation              | Name |
---------------------------------------
|   0 | SELECT STATEMENT       |      |
|   1 |  PARTITION RANGE SINGLE|      |
|   2 |   TABLE ACCESS FULL    | T1   |
---------------------------------------


14 rows selected.

set feedback only
select * from t1 where category <= 100;

50000 rows selected.

set feedback on
select * from table(dbms_xplan.display_cursor(null,null,'basic'));

PLAN_TABLE_OUTPUT
----------------------------------------------------------------------------------------------------
EXPLAINED SQL STATEMENT:
------------------------
select * from t1 where category <= 100

Plan hash value: 589593414

------------------------------------
| Id  | Operation           | Name |
------------------------------------
|   0 | SELECT STATEMENT    |      |
|   1 |  PARTITION RANGE ALL|      |
|   2 |   TABLE ACCESS FULL | T1   |
------------------------------------


14 rows selected.

Wait, WHAT??? All the queries doing FULL SCAN now? Why?

Oh ok, of course, since the index is UNUSABLE, Oracle is skipping it. If I change the DB parameter SKIP_UNUSED_INDEXES, I will receive an error:

alter session set skip_unusable_indexes = FALSE;

Session altered.

select * from t1 where category = 1;
select * from t1 where category = 1
*
ERROR at line 1:
ORA-01502: index 'CLAROE.I1' or partition of such index is in unusable state

alter session set skip_unusable_indexes = TRUE;

Session altered.

Ok, now I will solve the problem by rebuild the index partitions:

alter index i1 rebuild partition p1;

Index altered.

alter index i1 rebuild partition p2;

Index altered.

alter index i1 rebuild partition p3;

Index altered.

select index_name, partition_name, status, num_rows, last_analyzed from user_ind_partitions where index_name='I1'
UNION ALL
select index_name, NULL partition_name, status, num_rows, last_analyzed from user_indexes where index_name='I1'
order by 2 nulls first;

INDEX_NAME                          PARTITION_NAME       STATUS     NUM_ROWS LAST_ANALYZED
----------------------------------- -------------------- -------- ---------- -------------------
I1                                                       N/A               0 2023-04-19 17:28:53
I1                                  P1                   USABLE            2 2023-04-19 17:34:09
I1                                  P2                   USABLE            3 2023-04-19 17:34:11
I1                                  P3                   USABLE        49995 2023-04-19 17:34:14

4 rows selected.

Great, now the index partitions are USABLE again. But notice that the NUM_ROWS at the index level is still 0! The partitions rebuilt had their stats updated automatically, but the index-level stats did not change.

So, this is exactly the situation we were facing in our environment, and causing weird performance problems.

Here is an example:

set feedback only
select * from t1 where category <= 100;

50000 rows selected.

set feedback on
select * from table(dbms_xplan.display_cursor(null,null,'basic'));

PLAN_TABLE_OUTPUT
----------------------------------------------------------------------------------------------------
EXPLAINED SQL STATEMENT:
------------------------
select * from t1 where category <= 100

Plan hash value: 1976518054

-----------------------------------------------------------
| Id  | Operation                                  | Name |
-----------------------------------------------------------
|   0 | SELECT STATEMENT                           |      |
|   1 |  PARTITION RANGE ALL                       |      |
|   2 |   TABLE ACCESS BY LOCAL INDEX ROWID BATCHED| T1   |
|   3 |    INDEX RANGE SCAN                        | I1   |
-----------------------------------------------------------


15 rows selected.

Did you notice that??? My predicate is CATEGORY <= 100, which would bring ALL the 50000 rows. So clearly a FULL SCAN would be preferable. But the Optimizer chose to go via the index. Probably because the index stats are messed.

Let me finally fix this and see what happens:

exec dbms_stats.gather_index_stats(user,'I1')

PL/SQL procedure successfully completed.

select index_name, partition_name, status, num_rows, last_analyzed from user_ind_partitions where index_name='I1'
UNION ALL
select index_name, NULL partition_name, status, num_rows, last_analyzed from user_indexes where index_name='I1'
order by 2 nulls first;

INDEX_NAME                          PARTITION_NAME       STATUS     NUM_ROWS LAST_ANALYZED
----------------------------------- -------------------- -------- ---------- -------------------
I1                                                       N/A           50000 2023-04-19 17:41:27
I1                                  P1                   USABLE            2 2023-04-19 17:41:27
I1                                  P2                   USABLE            3 2023-04-19 17:41:27
I1                                  P3                   USABLE        49995 2023-04-19 17:41:27

4 rows selected.

Finally, only after rebuild the index partitions AND re-gatherings statistics on the index, now everything seems normal again.

Let me see if my query now picks the right plan, first removing the plan from memory to make sure the Optimizer will recalculate it:

begin
	for i in (
		select address || ',' || hash_value as add_hash
		from V$SQLAREA where sql_text like 'select * from t1 where category%'
	) loop
		sys.DBMS_SHARED_POOL.PURGE (i.add_hash, 'C');
	end loop;
end;
/

PL/SQL procedure successfully completed.

select address || ',' || hash_value as add_hash
from V$SQLAREA where sql_text like 'select * from t1 where category%';

no rows selected

set feedback only
select * from t1 where category = 1;

1 row selected.

set feedback on
select * from table(dbms_xplan.display_cursor(null,null,'basic'));

PLAN_TABLE_OUTPUT
----------------------------------------------------------------------------------------------------
EXPLAINED SQL STATEMENT:
------------------------
select * from t1 where category = 1

Plan hash value: 3860318639

-----------------------------------------------------------
| Id  | Operation                                  | Name |
-----------------------------------------------------------
|   0 | SELECT STATEMENT                           |      |
|   1 |  PARTITION RANGE SINGLE                    |      |
|   2 |   TABLE ACCESS BY LOCAL INDEX ROWID BATCHED| T1   |
|   3 |    INDEX RANGE SCAN                        | I1   |
-----------------------------------------------------------


15 rows selected.

set feedback only
select * from t1 where category <= 100;

50000 rows selected.

set feedback on
select * from table(dbms_xplan.display_cursor(null,null,'basic'));

PLAN_TABLE_OUTPUT
----------------------------------------------------------------------------------------------------
EXPLAINED SQL STATEMENT:
------------------------
select * from t1 where category <= 100

Plan hash value: 589593414

------------------------------------
| Id  | Operation           | Name |
------------------------------------
|   0 | SELECT STATEMENT    |      |
|   1 |  PARTITION RANGE ALL|      |
|   2 |   TABLE ACCESS FULL | T1   |
------------------------------------


14 rows selected.

Wonderful, now the queries are again picking the right plan, everything is OK!

NOTE: this was tested in Oracle versions 19.18 and 23.2, with the same results.

And that’s it. I hope you understood how dangerous this situation is, performance-wise. If you find something similar in the future, you already know: re-gather stats at the index level AFTER rebuilding the UNUSABLE partitions, and everything is going to be OK.

I hope you enjoy.

See you on the next one!

How to easily get the corresponding AWR Snapshots interval for an interval date

Hello,

This is another short script to help you translate a provided date interval into the corresponding AWR snapshots interval.

I don’t know if you also struggle with this, but sometimes I have difficulties in selecting the exact begin and end SNAP_ID based on a specific date interval. It’s because sometimes all that BEGIN_INTERVAL_TIME and END_INTERVAL_TIME confuses me a little bit 🙂 .

For example, if I want to get an AWR from yesterday 10 am until today 10 am, it’s not uncommon for me to select the initial snapshot as the one with BEGIN_INTERVAL_TIME at yesterday 10 am, that would have its END_INTERVAL_TIME at 11 am (assuming the default 1h snapshots interval). And then, when I extract the AWR, I realize its time window actually starts at 11 am instead of 10 am. This is because we need to use the SNAP_ID that ENDS at the starting point of our desired window.

I know, I know, it’s confusing. And this is why I wrote this script, to simplify things and make it easy.

This script just receives as parameters the BEGIN_DATE, END_DATE and the INST_ID of the instance. And then it returns the corresponding BEGIN_SNAP, END_SNAP, and also a flag showing is the database was restarted during the provided time window.

If the database was restarted, you CANNOT extract an AWR for that interval.

If there is no restart during the interval, then you can just extract your AWR by providing the outputted BEGIN and END_SNAP. Maybe using my provided script that will generate the AWR with a better file name 😉 .

So, here is the script dates_to_snaps.sql:

/*
dates_to_snaps.sql
This script shows the snapshot interval corresponding to a provided date/time interval, for a particular instance
Created by Eduardo Claro
*/

undef begin_time
undef end_time
undef inst_id

col min_time for a30
col max_time for a30
col restarted for a10

select min(SNAP_ID) begin_snap, max(SNAP_ID) end_snap, 
	min(END_INTERVAL_TIME) min_time, max(END_INTERVAL_TIME) max_time,
	case when count(distinct STARTUP_TIME) > 1 then 'YES' else 'NO' end RESTARTED
from (
	select
		a.*, lead(in_the_interval) over (order by SNAP_ID) as next_in_the_interval
	from (
		select SNAP_ID, END_INTERVAL_TIME, STARTUP_TIME,
			case when trunc(END_INTERVAL_TIME,'mi') > &&begin_time
				  and trunc(BEGIN_INTERVAL_TIME,'mi') < &&end_time
				then 1 else 0 end in_the_interval,
			row_number() over (order by snap_id desc) rn
		from dba_hist_snapshot s
		join v$database d using (DBID)
		where INSTANCE_NUMBER = nvl('&&inst_id','1')
		order by SNAP_ID
		) a
	) b
where in_the_interval = 1 or next_in_the_interval = 1;

Please note that I am truncating the snapshot dates at the minutes, disregarding the seconds. This is because it takes some seconds for the snapshot to be generated. Then, if you have a new snapshot at the top of every hour, most likely your snapshot dates will be like ’07:00:23′ instead of the “ideal” ’07:00:00′.

Another thing to note is that I am considering ANY snapshot that has at least a partial overlap with the provided time window. For example, if your time window is from 3:30 pm until 5:30 pm, and you have hourly snapshots, then the interval snapshots provided would be from 3 pm until 6 pm, thus covering your entire interval. In order to have this “expanded” window, I compare the END_INTERVAL_TIME with the provided begin time, and the BEGIN_INTERVAL_TIME with the provided end time. I know again, it sounds weird, but it works ;-).

And here is a sample run:

SQL> select sysdate from dual;

SYSDATE
-------------------
2023-04-13 14:20:08

1 row selected.

Elapsed: 00:00:00.16
SQL> @blog_posts/dates_to_snaps
Enter value for begin_time: sysdate-1
Enter value for end_time: sysdate
Enter value for inst_id: 1

BEGIN_SNAP   END_SNAP MIN_TIME                       MAX_TIME                       RESTARTED
---------- ---------- ------------------------------ ------------------------------ ----------
     57646      57742 2023-04-12 14:15:41.111        2023-04-13 14:15:19.739        NO

1 row selected.

In this example, I can run an AWR for the last 24 hours because there was no restart during the interval, and I would get it by providing the SNAP_IDs 57646 and 57742:

Screenshot 2023-04-13 at 4.21.40 PM

That’s it, I hope it can be useful.

Let me know if you have any questions, I would be happy to answer.

See you soon.

How to have AWRs with a more meaningful file name

Hello,

This is a short and easy one.

If you use AWR a lot, especially running the provided awrrpt.sql script, you probably have been in that situation when you create a lot of AWR reports, and right after (or days later) you end up not knowing which report is for which day, since the default name is just something like “awrrpt_1_235_236.html”, begin 235 the first snapshot and 236 the last one.

So, here I present a very simple script that will automatically create AWRs with a better name, and you can also run it from a SQL Plus client instead of connecting to the server to run awrrpt.

And that’s it, here is the script:

/*
This script generates AWR Reports with a user-friendly name
Created by Eduardo Claro
*/

undef begin_snap
undef end_snap
undef name
undef inst_id

SET VER OFF FEED OFF TIMING OFF ECHO OFF

col AWRSPOOL NEW_VALUE AWRSPOOL head "Generating AWR report, please wait..."
col DBID new_value DBID noprint
col INS new_value INS noprint
with snap as (
	select
		to_char(min(END_INTERVAL_TIME),'yyyy-mm-dd-hh24mi') min_snap,
		to_char(max(END_INTERVAL_TIME),'yyyy-mm-dd-hh24mi') max_snap
	from dba_hist_snapshot
	where snap_id between '&&begin_snap' and '&&end_snap'
)
select 
	DISTINCT DBID,
	INSTANCE_NUMBER INS,
	'c:\temp\' || 
	'AWR_&&begin_snap.-&&end_snap._' || 
	case when DATABASE_ROLE = 'PRIMARY' then DB_UNIQUE_NAME else PRIMARY_DB_UNIQUE_NAME end || 
	'_' || nvl('&&inst_id',i.instance_number) || '_' || 
	min_snap || '-' || max_snap || 
	case when '&&name' is not null then '_&&name' end ||
	'.html' as AWRSPOOL
from v$database d, v$instance i, snap s
;

prompt

set HEAD OFF term off

spool &awrspool

--Regular AWR report
select * from table(
	DBMS_WORKLOAD_REPOSITORY.AWR_REPORT_HTML(
	   l_dbid       =>    '&dbid',
	   l_inst_num   =>    '&ins',
	   l_bid        =>    '&begin_snap',
	   l_eid        =>    '&end_snap'))
;

spool off
set term on

prompt Report generated.

And here is a sample run:

SQL> @blog_posts/awr
Enter value for begin_snap: 211
Enter value for end_snap: 213
Enter value for inst_id:
Enter value for name:

Generating AWR report, please wait...
-----------------------------------------------------------------------------
c:\temp\AWR_211-213_BLDTSAWS_1_2023-04-11-0000-2023-04-11-0200.html

Report generated.

The result? Just an AWR report as you already know, but with a file name that will let you know not only the begin and end snapshot, but also the DB name, instance, begin and end date/time:

Screenshot 2023-04-12 at 5.17.40 PM

If you want a RAC AWR report, just change the call from AWR_REPORT_HTML to AWR_GLOBAL_REPORT_HTML, the parameters are the same.

That’s it, I hope it can be useful.

Converting intervals of values into an IN-list for query filters

Hello,

As you may know if you have checked some of the scripts or queries I post here, I like to use parameters and variables in my scripts, to make them more flexible to show me the results I want in a variety of situations.

Since I work with performance, I constantly have to query AWR and ASH views to check what happened in the database during a specific period. Most of these views have a DATE dimension that is usually the most frequent filter we used: in DBA_HIST_ACTIVE_SESSION_HISTORY for example, it’s SAMPLE_TIME. In DBA_HIST_SNAPSHOT it’s usually END_INTERVAL_TIME.

So, usually when we want to query these views we have a period to analyze, and a date interval that is translated in a predicate like this:

...
WHERE SAMPLE_TIME BETWEEN &START_DATE AND &END_DATE
...

But sometimes (or many times), just filtering the begin and end dates and times is not enough. What if for example I want to analyze only what occurred between 8 am and 6 pm? Or, only on Mondays and Wednesdays?

Then I would need to add more predicates to filter these specific days or hours. It’s relatively easy if you know the values. For example, I could include:

...
WHERE SAMPLE_TIME BETWEEN &START_DATE AND &END_DATE
AND EXTRACT(HOUR FROM SAMPLE_TIME) BETWEEN 8 AND 17
...

(Please note that if I want to check hours from between 8 and 18 by extracting the hour piece of the date, then I should put my interval as 8 and 17, to actually accept times between 08:00:00 and 17:59:59).

But I would like to receive this as a variable, and even more, I would like that my script would translate a complex set of intervals into an IN-list for then inject this into my main query as a filter.

I talking about this: If I want to filter the hour intervals to be “from 5 until 6, from 8 until 12, from 13 until 18 and from 23 until 2 (of the next day)”, I would pass as a parameter “5,8-11,13-17,23-1” (note again I’m subtracting 1 from the end as explained above, to use the EXTRACT of the hour piece), and it would be translated into 5,8,9,10,11,13,14,15,16,17,23,0,1.

So, here I present two versions of a simple script that does exactly it: the first translates a string with number intervals into a IN-list variable, and the second translate the intervals into a in-line view, both to be used in IN operators as I will show below.

The scripts receive 3 parameters:

  • &1: the string to be converted
  • &2: the first value of the interval
  • &3: the last value of the interval

In my example, I would pass “5,8-11,13-17,23-1” “0” “23”.

Here is the first script, that returns an IN-LIST:


col IN_LIST new_value IN_LIST
WITH 
a as (
	select nvl('&1','&2-&3') intervals, to_number('&2') fv, to_number('&3') lv
	from dual
),
b as (
	select level-1+fv val
	from a
	connect by level <= lv-fv+1
),
c as (
	select regexp_substr(intervals, '[^,]+', 1, level) col
	from a
	connect by level <= regexp_count(intervals, ',')+1
),
d as (
	select to_number(nvl(substr(col,1,instr(col,'-')-1),col)) minval, to_number(nvl(substr(col,instr(col,'-')+1,100),col)) maxval
	from c
),
e as (
	select minval, maxval
	from d, a
	where maxval >= minval
	UNION ALL
	select minval, lv
	from d, a
	where maxval < minval
	UNION ALL
	select fv, maxval
	from d, a
	where maxval < minval
),
intervals_to_IN as (
    select listagg(val,',') within group (order by val) IN_LIST
    from (
	select DISTINCT val
	from a, b, e
	where val between nvl(minval,fv) and nvl(maxval,lv)
	and val >= fv
	and maxval >= minval
	)
)
select * from intervals_to_IN
;

IN_LIST
------------------------------------------
0,1,5,8,9,10,11,13,14,15,16,17,23

1 row selected.

Then you could use it in your main query, like this:

select distinct EXTRACT(HOUR FROM SAMPLE_TIME)
from DBA_HIST_ACTIVE_SESS_HISTORY
where SAMPLE_TIME BETWEEN &START_DATE AND &END_DATE
and EXTRACT(HOUR FROM SAMPLE_TIME) IN (&IN_LIST)
order by 1;

(EXTRACT(HOURFROMSAMPLE_TIME))
------------------------------
                             0
                             1
                             5
                             8
                             9
                            10
                            11
                            13
                            14
                            15
                            16
                            17
                            23

13 rows selected.

And here is the second script, with just a slight change to return a IN-line view to be joined in the main query:

WITH 
a as (
	select nvl('&1','&2-&3') intervals, to_number('&2') fv, to_number('&3') lv
	from dual
),
b as (
	select level-1+fv val
	from a
	connect by level <= lv-fv+1
),
c as (
	select regexp_substr(intervals, '[^,]+', 1, level) col
	from a
	connect by level <= regexp_count(intervals, ',')+1
),
d as (
	select to_number(nvl(substr(col,1,instr(col,'-')-1),col)) minval, to_number(nvl(substr(col,instr(col,'-')+1,100),col)) maxval
	from c
),
e as (
	select minval, maxval
	from d, a
	where maxval >= minval
	UNION ALL
	select minval, lv
	from d, a
	where maxval < minval
	UNION ALL
	select fv, maxval
	from d, a
	where maxval < minval
),
hours as (
	select DISTINCT val as hour
	from a, b, e
	where val between nvl(minval,fv) and nvl(maxval,lv)
	and val >= fv
	and maxval >= minval
)
select /*+ NO_MERGE */ 
distinct EXTRACT(HOUR FROM SAMPLE_TIME)
from DBA_HIST_ACTIVE_SESS_HISTORY a
where SAMPLE_TIME between SYSDATE-1 and SYSDATE
and EXTRACT(HOUR FROM a.SAMPLE_TIME) in (select hour from hours)
order by 1
;

EXTRACT(HOURFROMSAMPLE_TIME)
----------------------------
                           0
                           1
                           5
                           8
                           9
                          10
                          11
                          13
                          14
                          15
                          16
                          17
                          23

13 rows selected.

(Note I used the NO_MERGE hint for performance purposes, to request the main query to be resolved first, before the inner query).

That’s it, I hope it can be useful.

I use this type of filter all the time to get the results filtered the way I want in my scripts.

Let me know if you have any comments.