I have replaced my Macbook some months ago, but since I was supporting a client that used Windows and I had to use a Windows VM, until now I had not reinstalled the Oracle Instant Client directly into my new Macbook.
As you may know, Oracle still does not provide an Oracle Instant Client version for ARM-based Macbooks. So, as far as I know we still have to use emulation in order to have it working in these computers. If there is another/better solution that I am not aware of, please let me know.
So, for this time, instead of posting here all the steps of my process with screenshots only, I have created a Video showing all the steps 🙂 . Please watch the video here.
The steps I have followed are in this link, but at least in my case I had to do same changes in order for all the steps to work. Please check the details in the video.
It’s not a professional video in any ways ok? Just a record of the steps with my explanations as I go thru the steps.
Some weeks ago, I was discussing with a friend about an issue he saw in some Oracle databases, kind of losing data, or in other words, seeing UNCOMMITTED data that later on disappeared.
Allowing a session to read uncommited data being changed in another transaction is a Transaction Isolation Level called READ UNCOMMITED, which is not supported by Oracle. Such type of read is known as a DIRTY READ.
Many database scholars argue that a dirty read should never be allowed, under any circumstances, which I tend to agree with. And Oracle seems to agree as well, since it does not support this by design, unlike other databases.
So, the idea of Oracle allowing such thing sounds crazy, right? Or maybe a bug?
Well, after some research this friend did, he found this post from Jonathan Lewis explaining a very rare but possible situation when these DIRTY READS could take place in Oracle and cause data confusion.
And I was able to reproduce the issue in several different versions, including 23c FREE.
In this post I will explain in details how to reproduce the issue, and then I will present the solution that will make the title of this post make sense.
Basically, the problem happens when the LGWR process hangs, avoiding the COMMIT to complete successfully. But the problem is the way Oracle works by default, the COMMIT steps are executed first in memory by writing the redo entries to the Redo Log Buffers and then calling LGWR to write them to Redo Log Files on disk. In the rare case when the LGWR is hung for whatever reason but the instance is still working, another session may end up querying and seeing the changed data event without the COMMIT being persisted to disk.
In order to reproduce the behavior, we will follow these steps exactly the way JL shows:
Initial Preparation
To prepare I will just create a table and insert a row of data:
col con_name for a10
col sid for a10
select SYS_CONTEXT ('userenv','con_name') con_name, SYS_CONTEXT ('userenv','sid') sid from dual;

CON_NAME   SID
---------- ----------
FREEPDB1   51

update t1 set n1 = 2;

1 row updated.

select * from t1;

	    N1
----------
	     2
Step 2 – Session 2 connects (or is already connected)
This is the session that will see the dirty read. It needs to be connected before the LGWR fails, because after that no new session will be able to connect.
col con_name for a10
col sid for a10
select SYS_CONTEXT ('userenv','con_name') con_name, SYS_CONTEXT ('userenv','sid') sid from dual;

CON_NAME   SID
---------- ----------
FREEPDB1   271
Step 3 – LGWR hangs
Let’s find the LGWR PID# and use it with oradebug to force a hang (put the process in a suspended state for the tests).
In order to use oradebug, I will need a third session connected as SYSDBA at the CDB level:
col con_name for a10
col sid for a10
select SYS_CONTEXT ('userenv','con_name') con_name, SYS_CONTEXT ('userenv','sid') sid from dual;

CON_NAME   SID
---------- ----------
CDB$ROOT   237

select * from session_privs where privilege = 'SYSDBA';

PRIVILEGE
----------------------------------------
SYSDBA
Then, I will identify the LGWR PID:
select pid from v$process where pname='LGWR';

       PID
----------
	    22
I won’t show it here, but you can test yourself that from this moment on, if you try to open a new session it will hang.
Step 4 – Session 1 issues a COMMIT
When the COMMIT is issued, first the server process attending that session will work in memory writing the COMMIT redo entry, and then calls LGWR to write the redo entries from the Redo Log Buffer into the Redo Log File on disk.
select SYS_CONTEXT ('userenv','con_name') con_name, SYS_CONTEXT ('userenv','sid') sid from dual;SQL> SQL>

CON_NAME   SID
---------- ----------
FREEPDB1   51

commit;
-- THE SESSION WILL HANG
Since the LGWR is hung, the COMMIT does not finish and the session also hangs. BUT, the work in memory is already done and so from the memory perspective the COMMIT was successful already.
Step 5 – Session 2 issues a SELECT against the data and receives a DIRTY READ in response
See that? Even with the COMMIT not confirmed and the redo data not persisted on disk, the Session 2 was able to see the data already modified, which should NOT be allowed.
So, this is a VERY VERY rare situation that only happened because a background process (the LGWR) stopped working properly, and right after, without the instance failing, a session changes data and another one checks that data. But although it’s rare, it can happen as we demonstrated here.
Simulating an instance failure
What happens now if the instance fails? Well, since the COMMIT was never persisted on disk, the transaction should be rolled back after the instance is back up, so theoretically the data change never happened.
Let’s see it in action: in the SYSDBA session, without resuming the LGWR, I will force a restart of the instance:
startup force
ORACLE instance started.

Total System Global Area 1603679416 bytes
Fixed Size		    5313720 bytes
Variable Size		  973078528 bytes
Database Buffers	  620756992 bytes
Redo Buffers		    4530176 bytes
Database mounted.
Database opened.
Now that the instance is up again, I will reconnect as a normal user and check the data:
col con_name for a10
col sid for a10
select SYS_CONTEXT ('userenv','con_name') con_name, SYS_CONTEXT ('userenv','sid') sid from dual;

CON_NAME   SID
---------- ----------
FREEPDB1   33

select * from t1;

        N1
----------
         1
As expected, the transaction was lost and the original value is back.
Now, the solution
So, as I mentioned in the beginning, I was able to reproduce the same behavior in different Oracle versions: 12, 19 and 23.
BUT, in 23c there is a new parameter called paranoid_concurrency_mode that controls this behavior. I don’t know exactly how this parameter works internally, since at this point I could not find any documentation about it.
This original value is FALSE, and when it is changed to TRUE, then the demonstrated behavior showed here does not happen. In this case, the Session 2 also hangs when trying to issue a SELECT against the changed data.
So, this is a solution for the problem, and also a very rare case when a SELECT can hang in Oracle.
Some important notes here:
I was only able to make the parameter to work by changing it at the CDB level, and restarting the instance (it’s not online modifiable). If I changed it at the PDB level the problem persisted, which makes sense since the LGWR is a background process for the instance, so to change its behavior it’s expected to change the parameter at the CDB level.
I don’t know what are the disadvantages of changing this parameter to TRUE, what else it changes or even what is the performance penalty for the instance. Although it’s not a hidden parameter (it doesn’t start with an hyphen), since there is no documentation at this point, you should ask My Oracle Support about changing it.
So that’s it for now.
This is just a study case, and PLEASE do not test or do any change in Production database without proper testings and in this particular case, having the OK from MOS.
This is a short post to help you if you get stuck when trying to enable EM Express for a Base DB Service VM in OCI.
For context: as part of my current studies to renew some OCI certifications (and get some new ones as well), I took advantage of the credits offered by the ACE Program (thanks ACE Program; if you are not an ACE Pro yet, this is one more incentive for you to pursue it 🙂 ) and created a Base DB Service.
After creating the DB System and trying several activities, I decided to enable Enterprise Manager Express to monitor the database.
According to the documentation, this process should be simple, just following some steps to enable the EM Express in the Listener configuration, then open the ports in IPTABLES and the Security List or Network Security Group.
Well, I did (at least I thought I did) all the steps for the configuration, but I spent a lot of time trying to reach the EM Express login page, without any success.
I came to create an Ubuntu compute instance in the same VCN and Subnet, with GUI, just to check if the problem was with the network access rules and I could access from within the VCN. Even from there, I still could not reach the EM page.
Then, researching a little bit more, I’ve found this linkwhere Alexis Blot-Lefevre explained how to do exactly what I was trying to do. I followed his process, which pretty much resembles the documentation, but then finally the EM Express worked!
So, what was the difference and what I did wrong in the first place?
Well, the documentation has a section with the title Set the RequiredPermissions On a 2-node RAC DB System, and it says: “If you’re using a 2-node RAC DB system, you’ll need to add read permissions for the asmadmin group on the wallet directory on both nodes in the system.”
Since my DB System is single-instance (just one node), non-RAC, I simply skipped this section assuming those steps were not required for my case. Did I understand it wrong or the documentation is not clear enough? Let me know your thoughts.
So, the difference was that in Alexi’s post he performed those steps regardless of being or not a RAC system.
Those steps simply change the permissions on the wallet files, making them readable by the entire group oinstall, of which the users oracle and grid are part. Originally, the files are readable only by the owner user, oracle.
Therefore, when you try to enable EM Express for a DB System in OCI, please make sure you change the permissions for the wallet files, even if you are in a non-RAC DB system. I guess it must be true for any Oracle database that uses a wallet.
That’s it for today.
Be thankful, if you look around you will se you have MUCH MORE reasons to be thankful than to complain, or be sad or hopeless.
“I want to bring to remembrance what gives me hope”.
It was a great time for me, and I would like to share here some thoughts about the experience and also encourage you to start doing the same, if you still don’t.
My first time
Along with my main career of Developer / DBA / Performance Specialist / Consultant for around 30 years, I also have around 15 years of experience teaching DBA and SQL language classes in Brazil. I guess some of my readers are former students that I had the privilege of sharing a little bit of knowledge with, which makes me happy :-).
So, I cannot say speaking in public is exactly something new for me.
You probably don’t know, but I also have several past experiences of singing in christian churches (I’m still a christian and I still love singing by the way), in chorals, groups and solo, so this also adds up as experience of performing publicly.
In addition, I have had other speaks in Oracle events years ago, but they were all online since we were still into the pandemic.
So, yesterday was for me the first time presenting in a conference in person, and also my first time ever speaking publicly in English!
As you may know, I am from Brazil and live in the US for 4 years now. Although I am of course improving my English skills every day, it’s still a challenge sometimes to find the right words and be able to communicate well the message I’m trying to pass.
So, because of this debut, I can say it was a challenge for me. The preparation was stressful as you may guess.
But it was worth it! It was a good time, I enjoyed a lot being there and sharing knowledge with a valuable tech audience, including some friends and people I admire for a long time, like Cary Millsap.
This is the beauty of participating in events like this.
So, let me take this opportunity and share some considerations about my experience yesterday.
Sharing Knowledge
This is one of the main purposes of conferences right? It’s a great opportunity for learning new things, or revisiting concepts you already knew.
Don’t think a speech is important only if it’s something you never heard about!
Like Cary said yesterday in his presentation, we feel good hearing about something we already know. It reinforces the importance of the subject, and it’s always good to see it revisited by a different person who may have a different perspective supported by their personal experience. Even for a well-known subject, there is always opportunity to learn different nuances that enrich the level of knowledge.
You should try
If you are a techie guy and never had the opportunity to speak in a conference, you should try it!
It’s an very enriching experience that will make you see things differently.
Don’t be afraid of trying, there’s always something to be said. It’s just a matter of thinking in a subject you like and has a certain level of knowledge and experience, build a presentation, prepare and speak!
Prepare for your presentation
this is very important. You have to choose the subject, then develop it and build the presentation.
And, more important, rehearse it. Make the presentation for yourself some times. This will improve your confidence, will help you find errors and adjust them, and have a sense of the time.
Control the time
This is not always easy. Some times you don’t have enough time to speak about everything you wanted to.
This happened to me yesterday, I ran out of time without finishing my presentation. It means next time I will need to pay more attention to this point.
Do networking
The best benefit you will personally get from presenting in conferences is the networking. By the way, this is also true for people that is attending the conferences rather than presenting.
You will meet new people, people that are relevant in your area. You will know them and they will know you.
And, if you are presenting, you will start to be more known, which is very important career-wise. Who knows, maybe you will find in the conference someone that will be your co-worker later. You can even find job opportunities doing network in conferences.
So, try to be present whenever possible. And, again, try to start speaking if you never did it. After you break the fears of doing it the first time, you will enjoy and improve every time.
A break, fresh air
Sometimes the routine of work is massive, right?
Everyday doing the same things, seeing and interacting with the same people, and for many only remotely in this new post-pandemic world!
So, going into a different place, meeting with different people that have the same interests than you, having a different day of learning and enjoyment, can be very refreshing!
Thanks
I would like to finish this post by thanking the Dallas Oracle User Groups staff for organizing the event and allowing me to be part of it. A special thank to Arun Yadav, my co-worker and the president of DOUG.
Hello, this post is kind of different of what I usually post about, but it may serve if anyone happens to hit the same bug and need an alternative solution.
These days I had to generate some huge CSV files with the content of some tables for an external entity to import into their non-Oracle database.
Since the volume of data was huge, I immediately ruled out any tool that would return the output to the client’s memory and then generate a CSV from the output, like SQL Developer for example. I decided to go with an option that could generate the CSV directly from the Oracle, as a result of a query.
So, the most straight forward option I could think of would be using the out-of-the-box SQL Plus capability of generating CSV files, by just issuing a SET MARKUP CSV command and then spooling the query result to a file.
The solution was very easy to implement with a script, but unfortunately when I tried to generate the files, some was receiving an error like this:
Both the database and the SQL Plus client are version 19.20.
So, I searched Oracle Support and found the Bug 30346729 that I was probably hitting. The Doc says the bug fix was included in 19.14.0.0.DBRU:220118. My database is 19.20, and I checked with OPatch lsinventory that the bug fix was indeed applied in our environment, so the bug should not be there anymore, but it is. I opened an SR and Oracle requested me a reproducible test case that I was not able to provide at first.
Initially, I could not find any rationale about what could be causing the issue. The error seemed to occur always at the same point for one particular table, but for a different one the point of fail was different in terms of number of rows generated or output file size.
I also tried to generate a small CSV file only with the rows starting from the point of failure (ordered to make sure I was hitting the “failed row”). If the bug was related to some particular data value or type, the error would show up again. But it didn’t.
So, based on my tests, it appeared to be more related to the volume of data, although not always the exact same volume. For one of my tables, the error was occurring after the CSV file had about 40 million rows. With this in mind, I tried and was finally able to build a reproducible test case that I present here.
If you want, you can run it in your test environment. That would be nice to see how different is your result in terms of file size and in different DB/client versions. Don’t worry, my test generates just about 4 GB of data, so not a big deal 😉 .
create table my_bp (
ID  NUMBER,
vc1 VARCHAR2(30),
vc2 VARCHAR2(30),
ts1 TIMESTAMP(6),
ts2 TIMESTAMP(6),
vc3 VARCHAR2(3),
vc4 VARCHAR2(3),
vc5 VARCHAR2(3),
vc6 VARCHAR2(3),
nu2 NUMBER,
nu3 NUMBER,
vc7 VARCHAR2(3),
dt1 DATE,
nu4 NUMBER(10,2),
vc8 VARCHAR2(1),
dt2 DATE,
vc9 VARCHAR2(1));

Table created.

insert into my_bp
WITH
A AS (select 1 from dual connect by rownum <= 1e6),
B AS (select 1 from dual connect by rownum <= 50)
select
	rownum,'01','01',systimestamp,systimestamp,
	'01','AB',NULL,NULL,
	1,1,NULL,sysdate,NULL,'N',
	sysdate,'N'
from a,b;

50000000 rows created.

commit;

Commit complete.
Here is the SQL script to generate the CSV file:
WHENEVER SQLERROR EXIT SQL.SQLCODE
alter session set nls_date_format='yyyy/mm/dd hh24:mi:ss';
alter session set nls_timestamp_format='yyyy/mm/dd hh24:mi:ss.ff';
set numwidth 38
set markup CSV on
set ver off echo off feed off
set term off
spool MY_BP.csv REPLACE
SELECT * FROM my_bp;
spool off
set term on
exit
Then we just execute it:
sqlplus test/test @run.sql


SQL*Plus: Release 19.0.0.0.0 - Production on Tue Oct 17 15:13:23 2023
Version 19.20.0.0.0

Copyright (c) 1982, 2022, Oracle.  All rights reserved.


Connected to:
Oracle Database 19c Enterprise Edition Release 19.0.0.0.0 - Production
Version 19.20.0.0.0


Session altered.


Session altered.


Session altered.


Session altered.

...
After some time… BOOM, error:
*** Error in `sqlplus': free(): invalid next size (fast): 0x00000000022c4000 ***
======= Backtrace: =========
/lib64/libc.so.6(+0x81329)[0x7fd03637f329]
/u01/app/oracle/product/19.0.0.1/dbhome_1/lib/libsqlplus.so(safifre+0x1a)[0x7fd03c425dea]
/u01/app/oracle/product/19.0.0.1/dbhome_1/lib/libsqlplus.so(+0x240a5)[0x7fd03c4130a5]
/u01/app/oracle/product/19.0.0.1/dbhome_1/lib/libsqlplus.so(+0x87aa8)[0x7fd03c476aa8]
/u01/app/oracle/product/19.0.0.1/dbhome_1/lib/libsqlplus.so(+0x6a6d1)[0x7fd03c4596d1]
In my environment, it took about 30 min for the error to appear. You could speed up the process by using parallelism in the query if you will.
Here is size of the file (remember it’s not complete because the error forces the process to abort):
$ ls -l
total 5859924
-rw-r--r--. 1 oracle oinstall 6000550943 Oct 17 15:26 MY_BP.csv
-rw-r--r--. 1 oracle oinstall        407 Oct 17 14:56 run.sql
$ wc -l MY_BP.csv

40890888 MY_BP.csv
In all my tests, the error appeared a little after 40 million rows in the output. But the number was not always the same.
At this point, Oracle Support did not come up with a solution yet. The workaround in the Doc says simply for you not to generate CSV from SQL Plus :-).
So, for my need, I tried to use SQLCL instead of SQL Plus, and it worked :-). So, it also shows that the bug is specific to SQL Plus, not related to data or anything else.
If you happen to receive the same error, I suggest you to check the note above and see if there is a new patch that could really solve the issue, or alternatively use SQLCL instead, just like I did.
Good moment to remember: when you hit a bug or even if you want to make a point about some feature or whatever you trying to showcase, it’s always very important that you can create a standalone, anonymous, reproducible test case for other people to test by themselves 🙂 .
NOTE: beside my client’s environment with DB version 19.20 where the error appeared and I managed to reproduce with the test case above, I also decided to test it in my MAC docker container with Oracle DB v.21.3, but using an instant client v. 19.3 from the MAC, and in this test environment I WAS NOT able to reproduce the error. So, keep this in mind.
Ultimately, this post is to document the error and maybe help someone that struggles with the same issue :-). For me, the best and easiest solution was to simply use SQLCL instead of SQL Plus.
In my previous post, I showed how to see USED and PEEKED bind variables from SQL Monitor views, either in memory and/or from AWR repository.
In this new one, I show how to see these same values from Execution Plans (either GV$SQL_PLAN and/or DBA_HIST_SQL_PLAN) as well as from Captured SQL binds (either from GV$SQL_BIND_CAPTURE and/or DBA_HIST_SQLBIND).
So, here is the same test case I’ve created in the previous post:
alter session set nls_date_format='yyyy-mm-dd hh24:mi:ss';
alter session set nls_timestamp_format='yyyy-mm-dd hh24:mi:ss.ff';

set serveroutput on
declare
    n number;
    c char;
    vc varchar2(10);
    dt date;
    ts timestamp;
    function run_query
    return number is
        rn number;
    begin
        select COL_N
        into rn
            from t
            where COL_VC!='MYQUERY3'
            and COL_N = n
            and COL_CH = c
            and COL_VC like vc
            and COL_DT = dt
            and COL_TS = ts
            ;
        return rn;
    exception when no_data_found then return (-1);
    end;
begin
    n := 1;
    c := 'A';
    vc := 'Edu%';
    dt := to_date('&mydt','yyyy-mm-dd hh24:mi:ss');
    ts := to_timestamp('&myts','yyyy-mm-dd hh24:mi:ss.ff');
    dbms_output.put_line(run_query);
    n := 2;
    c := 'B';
    vc := 'ABC%';
    dt := sysdate;
    ts := systimestamp;
    dbms_output.put_line(run_query);
end;
/

1
-1
Let me find the SQL_ID of my query:
select sql_id, executions, sql_text
from v$sql
where sql_text like q'[SELECT %COL_VC!='MYQUERY3'%]';

SQL_ID        EXECUTIONS SQL_TEXT
------------- ---------- ------------------------------------------------------------
fb3gqgd87ac8h          2 SELECT COL_N FROM T WHERE COL_VC!='MYQUERY3' AND COL_N = :B5

1 row selected.
Now, here is the script to get the bind values from the SQL Plans:
col bind_name format a10 wrap
col peeked_value format a40
col datatype head "DATA_TYPE" for a20
col src for a9

def sqlid="fb3gqgd87ac8h"
def datini=sysdate-1
def datfin=sysdate

select src, INST_ID, sql_id, plan_hash_value, child_number, c.bind_name, c.bind_pos, c.bind_type,
	decode(bind_type,1,'VARCHAR2',2,'NUMBER',12,'DATE',96,'CHAR',180,'TIMESTAMP',181,'TIMESTAMP WITH TZ',231,'TIMESTAMP WITH LTZ',to_char(bind_type)) datatype,
	case
		 when c.bind_type = 1 /*varchar2*/ then utl_raw.cast_to_varchar2(c.bind_data)
		 when c.bind_type = 2 /*number*/ then to_char(utl_raw.cast_to_number(c.bind_data))
		 when c.bind_type = 96 /*char*/ then to_char(utl_raw.cast_to_varchar2(c.bind_data))
		 when c.bind_type = 12 /*date*/ then TO_CHAR(dbms_stats.convert_raw_to_date(c.bind_data),'yyyy-mm-dd hh24:mi:ss')
		 when bind_type = 180 /*timestamp*/ then
				to_char(
					to_timestamp(
						to_char(
							dbms_stats.convert_raw_to_date(hextoraw(substr(bind_data,1,14)))
							,'yyyy-mm-dd hh24:mi:ss')
						,'yyyy-mm-dd hh24:mi:ss')
						+ numtodsinterval(nvl(to_number(hextoraw(substr(bind_data,15,8)),'XXXXXXXX')/1e9,0), 'SECOND')
					,'yyyy-mm-dd hh24:mi:ss.ff9')
		 else 'Not printable'
	end as peeked_value
from (
	select 'SQLPLAN-M' src, sql_id, plan_hash_value, OTHER_XML, child_number, INST_ID
	from gv$sql_plan
	UNION ALL
	select 'SQLPLAN-H' src, sql_id, plan_hash_value, OTHER_XML, to_number(NULL) as child_number, to_number(NULL) as INST_ID
	from dba_hist_sql_plan
	join dba_hist_snapshot using (DBID)
	where END_INTERVAL_TIME between &datini and &datfin
) p,
xmltable
	(
	'/*/peeked_binds/bind' passing xmltype(p.other_xml)
	columns
		bind_name varchar2(30) path './@nam',
		bind_pos number path './@pos',
		bind_type number path './@dty',
		bind_data  raw(2000) path '.'
	) c
where sql_id = '&sqlid'
and p.other_xml is not null
order by src, inst_id, sql_id, plan_hash_value, child_number, bind_pos, peeked_value
/

SRC        In SQL_ID             PLAN_HV CHILD_NUMBER BIND_NAME    BIND_POS  BIND_TYPE DATA_TYPE            PEEKED_VALUE
--------- --- ------------- ------------ ------------ ---------- ---------- ---------- -------------------- ----------------------------------------
SQLPLAN-M   1 fb3gqgd87ac8h   1601196873            0 :B5                 1          2 NUMBER               1
SQLPLAN-M   1 fb3gqgd87ac8h   1601196873            0 :B4                 2         96 CHAR                 A
SQLPLAN-M   1 fb3gqgd87ac8h   1601196873            0 :B3                 3          1 VARCHAR2             Edu%
SQLPLAN-M   1 fb3gqgd87ac8h   1601196873            0 :B2                 4         12 DATE                 2023-10-01 12:01:12
SQLPLAN-M   1 fb3gqgd87ac8h   1601196873            0 :B1                 5        180 TIMESTAMP            2023-10-01 12:01:12.123000000

5 rows selected.
NOTE: you can get peeked values from SQL Plans direct in your execution plan. Maria Colgan explains how you can do that here.
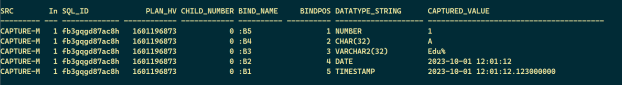
And here is the script to get the bind values from the Captured binds:
col bind_name format a10 wrap
col captured_value format a40
col DATATYPE_STRING for a20
col src for a9

def sqlid="fb3gqgd87ac8h"
def datini=sysdate-1
def datfin=sysdate

select DISTINCT src, INST_ID, sql_id, plan_hash_value, child_number,
	name as bind_name, position as bindpos, DATATYPE_STRING,
	case
		 when DATATYPE in (1,2,96) /*varchar2,number,char*/ then VALUE_STRING
         when DATATYPE = 12 /*date*/ then to_char(anydata.accessDate(value_anydata),'yyyy-mm-dd hh24:mi:ss')
         when DATATYPE = 180 /*timestamp*/ then to_char(anydata.accesstimestamp(value_anydata),'yyyy-mm-dd hh24:mi:ss.ff9')
		else 'Not printable'
	END captured_value
from (
	select 'CAPTURE-M' src,
		sql_id, child_number, PLAN_HASH_VALUE, INST_ID,
		name, position, datatype, DATATYPE_STRING, value_string, value_anydata
	from gv$sql_bind_capture
	join gv$sql s using (INST_ID, sql_id, child_number)
	UNION ALL
	select 'CAPTURE-H' src,
		sql_id, to_number(NULL) as child_number, to_number(NULL) PLAN_HASH_VALUE, INSTANCE_NUMBER as INST_ID,
		name, position, datatype, DATATYPE_STRING, value_string, value_anydata
	from dba_hist_sqlbind
	join dba_hist_snapshot using (DBID, INSTANCE_NUMBER, SNAP_ID)
	where END_INTERVAL_TIME between &datini and &datfin
	) c
where sql_id = '&sqlid'
order by src, INST_ID, sql_id, plan_hash_value, child_number, position, captured_value
/

SRC        In SQL_ID             PLAN_HV CHILD_NUMBER BIND_NAME     BINDPOS DATATYPE_STRING      CAPTURED_VALUE
--------- --- ------------- ------------ ------------ ---------- ---------- -------------------- ----------------------------------------
CAPTURE-M   1 fb3gqgd87ac8h   1601196873            0 :B5                 1 NUMBER               1
CAPTURE-M   1 fb3gqgd87ac8h   1601196873            0 :B4                 2 CHAR(32)             A
CAPTURE-M   1 fb3gqgd87ac8h   1601196873            0 :B3                 3 VARCHAR2(32)         Edu%
CAPTURE-M   1 fb3gqgd87ac8h   1601196873            0 :B2                 4 DATE                 2023-10-01 12:01:12
CAPTURE-M   1 fb3gqgd87ac8h   1601196873            0 :B1                 5 TIMESTAMP            2023-10-01 12:01:12.123000000

5 rows selected.
Sometimes, when you have to troubleshoot complex performance issues related to execution plans for queries that use bind variables, knowing the bind values used by the Optimizer becomes very important for the troubleshooting process. And in these cases, not only the bind value used at runtime for a particular execution is important, but also the value used at PARSING time (known as PEEKED value).
So, one wonderful tool to analyze SQL Executions is the SQL Monitor Report. If you don’t know much about SQL Monitor, please read here where Maria Colgan explains very well how to get the most out of this tool.
Well, although SQL Monitor is a very useful tool that I use all the time for performance analysis (I myself have written a few posts about it, find them here), there is something that several times made me sad and lose time: not always the SQL Monitor report shows all bind variables used and/or peeked.
Take for example this SQL Monitor report:
Note that all the PEEKED values as well as the TIMESTAMP datatype value in the Value column (the values used at runtime) are not shown correctly. Actually, the values presented are in RAW format, the way Oracle stores them in the database. Easy to understand that seeing values in the RAW format does not help much right?
I can’t confirm if this is true in all databases and all versions, but all that I have access at this point have the same “issue”. The database where the above report was generated is version 19.20.
So, in this post I will provide you a script that shows all the bind variable values for any generated SQL Monitor report in your database, either if it’s in memory (GV$SQL_MONITOR) or in the AWR repository (persisted in DBA_HIST_REPORTS%).
The script shows both the USED and PEEKED values, for all most common data types including TIMESTAMP. I did not implement it yet for TIMESTAMP WITH TIME ZONE and TIMESTAMP WITH LOCAL TIME ZONE, but it’s not that difficult so I will probably come up with an updated version soon.
As usual, I will provide you a test case so you can test the script even if you don’t have real data to test against.
Note that I defined two SQL Plus variables with a DATE and a TIMESTAMP values, just to make it easy to reuse the same values later on for the queries I’m going to execute.
Let me format the output for DATE and TIMESTAMP types and check the inserted data:
alter session set nls_date_format='yyyy-mm-dd hh24:mi:ss';
alter session set nls_timestamp_format='yyyy-mm-dd hh24:mi:ss.ff';
col col_N for 999
col col_ts for a26
select * from t;

Session altered.

Session altered.

COL_N C COL_VC     COL_DT              COL_TS
----- - ---------- ------------------- --------------------------
    1 A Edu$!123   2023-10-01 12:01:12 2023-10-01 12:01:12.123000

1 row selected.
Ok, now I will run a query with bind variables twice: the first execution will parse the query and generate the execution plan with bind values passed; the second one will use different values but use the same plan (with the same peeked values):
set serveroutput on
declare
	n number;
	c char;
	vc varchar2(10);
	dt date;
	ts timestamp;
	function run_query
	return number is
		rn number;
	begin
		select /*+ monitor */ COL_N
		into rn
			from t
			where COL_VC!='MYQUERY'
			and COL_N = n
			and COL_CH = c
			and COL_VC like vc
			and COL_DT = dt
			and COL_TS = ts
			;
		return rn;
	exception when no_data_found then return (-1);
	end;
begin
	n := 1;
	c := 'A';
	vc := 'Edu%';
	dt := to_date('&mydt','yyyy-mm-dd hh24:mi:ss');
	ts := to_timestamp('&myts','yyyy-mm-dd hh24:mi:ss.ff');
	dbms_output.put_line(run_query);
	n := 2;
	c := 'B';
	vc := 'ABC%';
	dt := sysdate;
	ts := systimestamp;
	dbms_output.put_line(run_query);
end;
/

1
-1
(EDIT 2023/10/10: I just noticed that I included parameters in my function but I never used their values, and it worked because the variables were declared globally so the function have access to them. The code was adjusted).
Note: I am using a PL/SQL block to declare the variables with the proper data type. I am not using SQL Plus bind variables because they cannot be declared directly as DATE or TIMESTAMP.
My PL/SQL block has a function that executes the SQL with the variables received as parameters, and returns the number value in COL_N column, or -1 if no record is found.
After running the PL/SQL block, we will have the two executions stored in the V$SQL_MONITOR view. Please note that I included in the query a string MYQUERY to help identify the query. If you need to rerun the test again you may want to change the string:
col sql_text for a60 trunc
select sql_id, sql_exec_start, sql_exec_id, sql_text
from v$sql_monitor
where sql_text like 'SELECT /*+ monitor */%MYQUERY%';

SQL_ID        SQL_EXEC_START      SQL_EXEC_ID SQL_TEXT
------------- ------------------- ----------- ------------------------------------------------------------
gs8mw9wayq4dm 2023-10-09 15:35:54    16777216 SELECT /*+ monitor */ COL_N FROM T WHERE COL_VC!='MYQUERY' A
gs8mw9wayq4dm 2023-10-09 15:35:54    16777217 SELECT /*+ monitor */ COL_N FROM T WHERE COL_VC!='MYQUERY' A
Run the following query to generate the SQL Monitor for the last execution:
alter session set events = 'emx_control compress_xml=none';
set lines 32767 trimout on trimspool on head off feed off echo off timing off termout off long 1000000 longchunksize 1000000 ver off pages 0
spool sqlmon.html
select DBMS_SQL_MONITOR.report_sql_monitor(
sql_id => max(a.sql_id),
sql_exec_id => max(a.sql_exec_id),
sql_exec_start => max(a.sql_exec_start),
report_level=>'ALL',type=>'ACTIVE')
from v$sql_monitor a
where sql_text like 'SELECT /*+ monitor */%MYQUERY%';
spool off
Then, open the SQL Monitor in a web browser, click on the SQL Text tab and expand the SQL Binds section:
See? Again, all the PEEKED values are presented as RAW, as well as the TIMESTAMPs.
My friend Marcus Vinicius Miguel Pedro found the Doc ID 2111950.1 that points to a Bug, but at least until Oracle v. 19.20 which I am using, the bug is still there. And the note mentions only the TIMESTAMP issue, but not the PEEKED values.
So, here I present the script you can use to properly get all PEEKED and USED values, for data types NUMBER, CHAR, VARCHAR2, DATE and TIMESTAMP.
def sqlid="gs8mw9wayq4dm"
def exec=""
def phv=""
def ins="1"
def datini="sysdate-30"
def datfin="sysdate"

col bind_name format a10 wrap
col used_value format a40
col peeked_value format a40

WITH
reports as (
	select *
	from (
		select snap_id, INSTANCE_NUMBER, r.key1 as sql_id, to_number(r.key2) as sql_exec_id, d.REPORT, r.report_summary,
			to_number(EXTRACTVALUE(XMLType(r.report_summary),'/report_repository_summary/sql/plan_hash')) SQL_PLAN_HASH_VALUE
		from DBA_HIST_REPORTS_DETAILS d
		natural join DBA_HIST_REPORTS r
		where r.component_name = 'sqlmonitor'
		AND r.report_name = 'main'
		AND KEY1='&sqlid'
		and ('&exec' is null or KEY2 = to_number('&exec'))
		and ('&ins' is null or INSTANCE_NUMBER = to_number(nvl('&ins','1')))
		and GENERATION_TIME between &datini and &datfin
	)
	where ('&phv' is null or SQL_PLAN_HASH_VALUE = to_number('&phv'))
),
reports_u as (
	select
		snap_id, INSTANCE_NUMBER, sql_id, sql_exec_id, bind_name, bind_pos, bind_type, bind_typestr,
 		case
			 when bind_type in (1,2,96) /*varchar2,number,char*/ then bind_data
 			 when bind_type = 12 /*date*/ then to_char(to_date(bind_data,'mm/dd/yyyy hh24:mi:ss'),'yyyy-mm-dd hh24:mi:ss')
 			 when bind_type = 180 /*timestamp*/ then
					to_char(
						to_timestamp(
							to_char(
								dbms_stats.convert_raw_to_date(hextoraw(substr(bind_data,1,14)))
								,'yyyy-mm-dd hh24:mi:ss')
							,'yyyy-mm-dd hh24:mi:ss')
							+ numtodsinterval(nvl(to_number(hextoraw(substr(bind_data,15,8)),'XXXXXXXX')/1e9,0), 'SECOND')
						,'yyyy-mm-dd hh24:mi:ss.ff9')
 			 else 'Not printable'
 		end used_value
	from reports r
	cross join xmltable
		(
		'/report/sql_monitor_report/binds/bind' passing xmltype(REPORT)
		columns
			bind_name varchar2(30) path './@name',
			bind_pos  number path './@pos',
			bind_type number path './@dty',
			bind_typestr varchar2(30) path './@dtystr',
			bind_data varchar2(1000) path '.'
		) c
),
reports_p as (
	select
		snap_id, INSTANCE_NUMBER, sql_id, sql_exec_id, bind_name, bind_pos, bind_type, bind_typestr,
 		case
 			 when bind_type = 1 /*varchar2*/ then utl_raw.cast_to_varchar2(bind_data)
 			 when bind_type = 2 /*number*/ then to_char(utl_raw.cast_to_number (bind_data))
 			 when bind_type = 96 /*char*/ then to_char(utl_raw.cast_to_varchar2(bind_data))
 			 when bind_type = 12 /*date*/ then TO_CHAR(dbms_stats.convert_raw_to_date(bind_data),'yyyy-mm-dd hh24:mi:ss')
 			 when bind_type = 180 /*timestamp*/ then
					to_char(
						to_timestamp(
							to_char(
								dbms_stats.convert_raw_to_date(hextoraw(substr(bind_data,1,14)))
								,'yyyy-mm-dd hh24:mi:ss')
							,'yyyy-mm-dd hh24:mi:ss')
							+ numtodsinterval(nvl(to_number(hextoraw(substr(bind_data,15,8)),'XXXXXXXX')/1e9,0), 'SECOND')
						,'yyyy-mm-dd hh24:mi:ss.ff9')
 			 else 'Not printable'
 		end peeked_value
	from reports r
	cross join xmltable
		(
		'/report/sql_monitor_report/plan/operation/other_xml/peeked_binds/bind'
		passing xmltype(REPORT)
		columns
			bind_name varchar2(30) path './@nam',
			bind_pos  number path './@pos',
			bind_type number path './@dty',
			bind_typestr varchar2(30) path './@dtystr',
			bind_data varchar2(1000) path '.'
		) p
),
reports_binds as (
	select snap_id, INSTANCE_NUMBER, sql_id, sql_exec_id, bind_name, bind_pos,
		u.bind_type, u.bind_typestr,
		u.used_value, p.peeked_value
	from reports_p p
	full join reports_u u using (snap_id, INSTANCE_NUMBER, sql_id, sql_exec_id, bind_name, bind_pos)
	order by bind_pos
),
sqlmon as (
	select INST_ID, sql_id, sql_exec_id, BINDS_XML, SQL_CHILD_ADDRESS, SQL_PLAN_HASH_VALUE
	from gv$sql_monitor m
	where SQL_ID='&sqlid'
	and ('&exec' is null or SQL_EXEC_ID = to_number('&exec'))
	and ('&ins' is null or INST_ID = to_number(nvl('&ins','1')))
	and ('&phv' is null or SQL_PLAN_HASH_VALUE = to_number('&phv'))
	and SQL_PLAN_HASH_VALUE <> 0
	and nvl(PX_QCSID,SID) = SID and nvl(PX_QCINST_ID,INST_ID) = INST_ID --don't show Parallel slaves
	and SQL_EXEC_START between &datini and &datfin
),
sqlmon_u as (
	select
		INST_ID, sql_id, sql_exec_id, bind_name, bind_pos, bind_type, bind_typestr,
 		case
			 when bind_type in (1,2,96) /*varchar2,number,char*/ then bind_data
 			 when bind_type = 12 /*date*/ then to_char(to_date(bind_data,'mm/dd/yyyy hh24:mi:ss'),'yyyy-mm-dd hh24:mi:ss')
 			 when bind_type = 180 /*timestamp*/ then
					to_char(
						to_timestamp(
							to_char(
								dbms_stats.convert_raw_to_date(hextoraw(substr(bind_data,1,14)))
								,'yyyy-mm-dd hh24:mi:ss')
							,'yyyy-mm-dd hh24:mi:ss')
							+ numtodsinterval(nvl(to_number(hextoraw(substr(bind_data,15,8)),'XXXXXXXX')/1e9,0), 'SECOND')
						,'yyyy-mm-dd hh24:mi:ss.ff9')
 			 else 'Not printable'
 		end as used_value
	from sqlmon
	cross join xmltable
		(
			'/binds/bind' passing xmltype(BINDS_XML)
			columns
				bind_name varchar2(30) path './@name',
				bind_pos  number path './@pos',
				bind_type number path './@dty',
				bind_typestr varchar2(30) path './@dtystr',
				bind_data varchar2(1000) path '.'
		) u
	where BINDS_XML is not null
),
sqlmon_plan_p as (
	select
		m.INST_ID, m.sql_id, m.sql_exec_id, x.bind_name, x.bind_pos, x.bind_type,
 		case
			 when bind_type = 1 /*varchar2*/ then utl_raw.cast_to_varchar2(bind_data)
 			 when bind_type = 2 /*number*/ then to_char(utl_raw.cast_to_number (bind_data))
 			 when bind_type = 96 /*char*/ then to_char(utl_raw.cast_to_varchar2(bind_data))
 			 when bind_type = 12 /*date*/ then TO_CHAR(dbms_stats.convert_raw_to_date(bind_data),'yyyy-mm-dd hh24:mi:ss')
 			 when bind_type = 180 /*timestamp*/ then
					to_char(
						to_timestamp(
							to_char(
								dbms_stats.convert_raw_to_date(hextoraw(substr(bind_data,1,14)))
								,'yyyy-mm-dd hh24:mi:ss')
							,'yyyy-mm-dd hh24:mi:ss')
							+ numtodsinterval(nvl(to_number(hextoraw(substr(bind_data,15,8)),'XXXXXXXX')/1e9,0), 'SECOND')
						,'yyyy-mm-dd hh24:mi:ss.ff9')
 			 else 'Not printable'
 		end peeked_value
	from sqlmon m, gv$sql_plan p,
        xmltable
		(
			'/*/peeked_binds/bind' passing xmltype(p.OTHER_XML)
			columns
				bind_name varchar2(30) path './@nam',
				bind_pos  number path './@pos',
				bind_type number path './@dty',
				bind_data varchar2(1000) path '.'
		) x
	where p.OTHER_XML is not null
    and m.inst_id = p.inst_id
    and m.sql_id = p.sql_id
    and m.SQL_CHILD_ADDRESS = p.child_address
),
sqlmon_binds as (
	select INST_ID, sql_id, sql_exec_id, bind_name, bind_pos,
		u.bind_type, u.bind_typestr,
		u.used_value, p.peeked_value
	from sqlmon_plan_p p
	full join sqlmon_u u using (INST_ID, sql_id, sql_exec_id, bind_name, bind_pos)
)
select 'HIST' src, snap_id, instance_number as inst, sql_id, sql_exec_id,
	bind_name, bind_pos, bind_type, bind_typestr, used_value, peeked_value
from reports_binds
UNION ALL
select 'MEM' src, NULL as snap_id, inst_id as inst, sql_id, sql_exec_id,
	bind_name, bind_pos, bind_type, bind_typestr, used_value, peeked_value
from sqlmon_binds
order by src, snap_id, inst, sql_id, sql_exec_id, bind_pos, used_value, peeked_value
/

SRC     SNAP_ID       INST SQL_ID        SQL_EXEC_ID BIND_NAME    BIND_POS  BIND_TYPE BIND_TYPESTR                   USED_VALUE                               PEEKED_VALUE
---- ---------- ---------- ------------- ----------- ---------- ---------- ---------- ------------------------------ ---------------------------------------- ----------------------------------------
HIST        214          1 gs8mw9wayq4dm    16777216 :B5                 1          2 NUMBER                         1                                        1
HIST        214          1 gs8mw9wayq4dm    16777216 :B4                 2         96 CHAR(32)                       A                                        A
HIST        214          1 gs8mw9wayq4dm    16777216 :B3                 3          1 VARCHAR2(32)                   Edu%                                     Edu%
HIST        214          1 gs8mw9wayq4dm    16777216 :B2                 4         12 DATE                           2023-10-01 12:01:12                      2023-10-01 12:01:12
HIST        214          1 gs8mw9wayq4dm    16777216 :B1                 5        180 TIMESTAMP                      2023-10-01 12:01:12.123000000            2023-10-01 12:01:12.123000000
HIST        214          1 gs8mw9wayq4dm    16777217 :B5                 1          2 NUMBER                         2                                        1
HIST        214          1 gs8mw9wayq4dm    16777217 :B4                 2         96 CHAR(32)                       B                                        A
HIST        214          1 gs8mw9wayq4dm    16777217 :B3                 3          1 VARCHAR2(32)                   ABC%                                     Edu%
HIST        214          1 gs8mw9wayq4dm    16777217 :B2                 4         12 DATE                           2023-10-09 15:35:54                      2023-10-01 12:01:12
HIST        214          1 gs8mw9wayq4dm    16777217 :B1                 5        180 TIMESTAMP                      2023-10-09 15:35:54.432043000            2023-10-01 12:01:12.123000000
MEM                      1 gs8mw9wayq4dm    16777216 :B5                 1          2 NUMBER                         1                                        1
MEM                      1 gs8mw9wayq4dm    16777216 :B4                 2         96 CHAR(32)                       A                                        A
MEM                      1 gs8mw9wayq4dm    16777216 :B3                 3          1 VARCHAR2(32)                   Edu%                                     Edu%
MEM                      1 gs8mw9wayq4dm    16777216 :B2                 4         12 DATE                           2023-10-01 12:01:12                      2023-10-01 12:01:12
MEM                      1 gs8mw9wayq4dm    16777216 :B1                 5        180 TIMESTAMP                      2023-10-01 12:01:12.123000000            2023-10-01 12:01:12.123000000
MEM                      1 gs8mw9wayq4dm    16777217 :B5                 1          2 NUMBER                         2                                        1
MEM                      1 gs8mw9wayq4dm    16777217 :B4                 2         96 CHAR(32)                       B                                        A
MEM                      1 gs8mw9wayq4dm    16777217 :B3                 3          1 VARCHAR2(32)                   ABC%                                     Edu%
MEM                      1 gs8mw9wayq4dm    16777217 :B2                 4         12 DATE                           2023-10-09 15:35:54                      2023-10-01 12:01:12
MEM                      1 gs8mw9wayq4dm    16777217 :B1                 5        180 TIMESTAMP                      2023-10-09 15:35:54.432043000            2023-10-01 12:01:12.123000000

20 rows selected.
As you can see in the putput above, all the variables were presented with their correct, readable values.
Please note that I have included in the script the following filters you can use:
SQL_ID (mandatory)
SQL_EXEC_ID
PHV (SQL Plan Hash Value)
INS (instance)
DATINI and DATFIN (for the period to research)
That it for today.
I hope you can find it useful.
EDIT: I forgot to mention some of the sources that helped me to decode the information and build the script: JonathanLewis and Bertrand Drouvot, and Tanel Poder. What a Team hum 🙂 ?
In my last post, I presented a tricky situation that happened in a client’s Production database, that caused enq: TM – contention waits, and in order to determine the root cause I queried ASH looking for locks. I mentioned there that I used a different script that presented the locks much like the good, old Oracle provided utllockt.sql script, which clearly shows the locks in a queue that allows us to determine who is the real troubler (i.e., the session that is/was locking but not also locked by another one).
When you have a complex lock situation, you may have several sessions that are holding/locking others, but they themselves are also waiting/being locked by another session, in a queue. And then you have usually one, at the top of the queue, that is holding all others direct or indirectly, but not waiting on any session. This is usually the ” villain” we are looking for.
It’s worth mentioning that when I say lock here, I am referring to any possible wait event that could make other sessions to wait. This could be the most known/common lock wait enq: TX – row lock contention, the enq: TM – contention , but it can also be something like a library cache lock, log file sync and other locks related to instance activity.
For example, this is the image in the previous post that highlights what was happening exactly at 2023-08-01 17:26:53:
Can you see how the queue of locks is shown with an indentation in the SESSION (SID) column? This is how utllockt.sql used to show locks, showing that the less indented session is the one holding all others. In the picture above, it is the top row in yellow, SID 8359.
So, in this post I will present the script that I’ve created to show this queue of locks, in a timeline for every SAMPLE_TIME in ASH where such locks existed. With this script, you can easily determine exactly when the problematic situation started, and what was the session that started holding others. I have improved the script a bit after my last post, so the columns and the output is not exactly the same. I have also included some filters that you can uncomment to see only what you want, the right way. I will explain this better below.
The structure of the SQL code is very different from what I presented in a recent post on how to show locks in ASH. In that case, I was interest in finding information for a blocking session, even if it was INACTIVE at the moment of the lock, thus not being captured by ASH at that point in time. I then searched backwards to see if the holding session was active in the recent past, and then present the relevant information to hold identify the holder. In this new one, the target is to show the timeline and the chain of the locks. I did not include in this new one the “intelligence” of looking backwards to find information about the holding session if it’s INACTIVE. It’s an improvement I will do an post soon, so stay tuned.
All that being said, let me present the script:
def DATINI="2023-08-01:17:25:00"
def DATFIN="2023-08-01:17:28:00"

alter session set nls_date_format='yyyy-mm-dd hh24:mi:ss';

clear breaks
col sidqueue for a20 head "SID|QUEUE"
col COMPLETE_SESSION_ID for a14 head "SESSION_ID"
col USERNAME for a15 wrap
col MODULE for a15 wrap
col EVENT for a20 wrap
col OBJ for a30 wrap
col MINUTOS for 999.9
break on sample_time skip page on level
set pages 1000

with ash as (
	select a.*,
		O.OWNER || '.' || O.OBJECT_NAME as obj,
		u.username,
		case when blocking_session is NULL then 'N' else 'Y' end IS_WAITING,
		case
			when
			instr(
				listagg(DISTINCT '.'||blocking_session||'.')
					WITHIN GROUP (order by blocking_session)
					OVER (partition by sample_id) ,
				'.'||session_id||'.'
				) = 0
			then 'N'
			else 'Y'
			end as IS_HOLDING,
		case
			when blocking_session is NULL then NULL
			when instr(
				listagg(DISTINCT '.'||session_id||'.')
					WITHIN GROUP (order by session_id)
					OVER (partition by sample_id) ,
				'.'||blocking_session||'.'
				) = 0
			then 'N'
			else 'Y'
			end as IS_BLOCKING_SID_ACTIVE
	from dba_hist_active_sess_history a
	left join dba_objects o on o.object_id = a.CURRENT_OBJ#
	left join dba_users u on u.user_id = a.user_id
	where SAMPLE_TIME between &datini and &datfin
),
ash_with_inactive as (
-- I need to include the inactive blocking sessions because ASH does not record INACTIVE
    select
        sample_id, cast(sample_time as date) as sample_time,
        session_id, session_serial#, instance_number,
        blocking_session, blocking_session_serial#, blocking_inst_id,
        sql_id, sql_exec_start, sql_exec_id, TOP_LEVEL_SQL_ID, XID,
        username, module, nvl(event,'On CPU') event,
		sysdate + ( (sample_time - min(sample_time) over (partition by session_id, session_serial#, instance_number, event_id, SEQ#)) * 86400) - sysdate as swait,
        obj,
        IS_WAITING, IS_HOLDING, 'Y' IS_ACTIVE, IS_BLOCKING_SID_ACTIVE
    from ash
    UNION ALL
    select DISTINCT
        sample_id, cast(sample_time as date) as sample_time,
        blocking_session as session_id, blocking_session_serial# as session_serial#, blocking_inst_id as instance_number,
        NULL as blocking_session, NULL as blocking_session_serial#, NULL as blocking_instance,
        NULL as sql_id, NULL as sql_exec_start, NULL as sql_exec_id, NULL as TOP_LEVEL_SQL_ID, NULL as XID,
        NULL as username, NULL as module, '**INACTIVE**' as event, NULL as swait, NULL as obj,
        'N' as IS_WAITING, 'Y' as IS_HOLDING, 'N' IS_ACTIVE, null as IS_BLOCKING_SID_ACTIVE
    from ash a1
    where IS_BLOCKING_SID_ACTIVE = 'N'
),
locks as (
    select b.*,
        listagg(DISTINCT '.'||event||'.') within group (order by lock_level) over (partition by sample_id, top_level_sid) event_chain,
        listagg(DISTINCT '.'||username||'.') within group (order by lock_level) over (partition by sample_id, top_level_sid) user_chain,
        listagg(DISTINCT '.'||module||'.') within group (order by lock_level) over (partition by sample_id, top_level_sid) module_chain,
        listagg(DISTINCT '.'||obj||'.') within group (order by lock_level) over (partition by sample_id, top_level_sid) obj_chain,
        listagg(DISTINCT '.'||xid||'.') within group (order by lock_level) over (partition by sample_id, top_level_sid) xid_chain,
        listagg(DISTINCT '.'||session_id||'.') within group (order by lock_level) over (partition by sample_id, top_level_sid) sid_chain,
        listagg(DISTINCT '.'||sql_id||'.') within group (order by lock_level) over (partition by sample_id, top_level_sid) sql_id_chain
    from (
        select a.*,
            rownum rn, level lock_level,
            case when level > 2 then lpad(' ',2*(level-2),' ') end ||
                case when level > 1 then '+-' end || session_id as sidqueue,
            session_id || ',' || session_serial# || '@' || instance_number COMPLETE_SESSION_ID,
            CONNECT_BY_ROOT session_id as top_level_sid
        from ash_with_inactive a
        connect by
            prior sample_id = sample_id
            and prior session_id = blocking_session
            and prior instance_number = blocking_inst_id
            and prior session_serial# = blocking_session_serial#
        start with
            IS_HOLDING = 'Y' and IS_WAITING = 'N'
        order SIBLINGS by sample_time, swait desc
    ) b
)
select
--     sample_id,
    sample_time, lock_level, sidqueue, COMPLETE_SESSION_ID,
    username, module, xid,
    event, swait, OBJ,
    sql_id, sql_exec_start, sql_exec_id, top_level_sql_id
from locks
where 1=1
--and event_chain like '%TM%contention%'
--and user_chain like '%PROD_BATCH%'
--and module_chain like '%PB%'
--and obj_chain like '%PGM%'
--and xid_chain like '%1300%'
--and sid_chain like '%7799%'
--and sql_id_chain like '%fmxzsf8gxn0ym%'
order by rn
/
Here are some comments about the script:
You have to provide the time interval you want to search into with the variables &datini and &datfin in the format ‘yyyy-mm-dd:hh24:mi:ss’, just like I did in the first two lines of the block above.
I am searching the historical view DBA_HIST_ACTIVE_SESS_HISTORY. You can easily adjust it to search the recent history in GV$ACTIVE_SESSION_HISTORY, but just changing the table name and the instance column name (INST_ID instead of INSTANCE_NUMBER).
The script was not tested in a RAC environment. Although it was created with also RAC in mind, there may be a bug that I did not identify since I didn’t test it. If you find something wrong, let me know.
In order to use the CONNECT BY hierarchical query, I had to manually “create” rows in my result for the holding sessions, to serve as the root rows for each queue. This is necessary because there may be INACTIVE sessions holding others, but not captured by ASH (since ASH by default only captures ACTIVE sessions).
I’ve created strings with the chain of events, users, modules, objects, transaction IDs, SIDs and SQL_IDs for each queue of locks. This way you can properly filter only the queues of your interest (using LIKE), that had a particular event, or a particular username, and so on. For this, I left commented the filters you can use. Uncomment the ones that make sense for you search in particular. Please note that I could not simply filter the source without creating that chain. For example, if I filter by USERNAME directly, the results would show only the rows of that user, not the entire queue of locks that user was involved in. So the result would be wrong.
The column SWAIT shows the number of seconds the session was waiting for that particular event, but this considers only the time window of the query and considers the difference in time between the current sample time and the first sample time of that particular event (and sequence). So, it may not be 100% accurate if the event started before the time window of the query, and because it considers the ASH samples that occur every 10s (which means the actual number of seconds could be +/- 10s of what is shown).
Now, I will create a queue of locks in order to demonstrate the script and allow you to see it in action as well ;-).
Session 1
So, first I will create a table with some data for me to play with:
create table t (id number, last_update date);
insert into t select level, sysdate from dual connect by level <= 5;
commit;
select * from t;

Table created.

5 rows created.

Commit complete.

        ID LAST_UPDATE
---------- -------------------
         1 2023-10-02 15:58:32
         2 2023-10-02 15:58:32
         3 2023-10-02 15:58:32
         4 2023-10-02 15:58:32
         5 2023-10-02 15:58:32

5 rows selected.
Then, I will update the first row and let the session inactive holding the row.
select userenv('sid') from dual;

USERENV('SID')
--------------
           278

update t set last_update = sysdate where id=1;

1 row updated.
Session 2
Now, in a second session, I will update the row with ID=2 and then try to update the same row of Session 1, which will will be locked:
select userenv('sid') from dual;

USERENV('SID')
--------------
          1206

update t set last_update = sysdate where id=2;

1 row updated.

update t set last_update = sysdate where id=1;
-- This will be locked
Session 3
After waiting a few seconds (I’ve included a sleep in the code, just to make sure we have distinct samples with just the first lock situation and then both locks), I will start a third session and also try to update the row with ID=2, which will be locked.
exec dbms_session.sleep(30);

PL/SQL procedure successfully completed.

select userenv('sid') from dual;

USERENV('SID')
--------------
            52

update t set last_update = sysdate where id=2;
-- This will be locked
Monitoring Session
Now, in another session, I will run the script and see the results (for brevity and clarity, I am only showing the rows for the last moment before Session 3 was locked and the first moment after it:
(NOTE: if the Session 3 does not appear in your result right away, just wait a little bit more for the information to be registered in the DBA_HIST view. You may need to wait some minutes for it to show up; other options would be changing the script to use V$ instead, or changing the _ash_size parameter at the instance level to force the ASH information to flush to disk faster).
So, the results show that until 10:54:51 (actually until some point between 10:54:51 and 10:55:02 which is the next captured sample), my Session 1 (SID 278) was INACTIVE and holding my Session 2 (SID 1206).
In the next sample time at 10:55:02, my Session 3 (SID 52) shows up also waiting for Session 2 (SID 1206), which is still waiting for Session 1 (SID 278). So, we have a queue of locks with three levels :-).
Conclusion
So, with this script you can clearly follow the timeline of occurrences in your database and track when the chain of issues started, and what was THE session or sessions that caused the initial issue, helping you identify root cause for tricky situations involving any type of lock.
If you didn’t yet, please read my previous post when I explain a real situation and how I was able to determine the root cause by using this script.
And that’s it for now. I hope you like it and it’s useful. If you happen to use this script and could solve important situations using it, please let me know. It would be great!!!
I would highly recommend you to also take a look at Tanel Poder’s script ash_wait_chains.sqlhere, where he shows chains of events that could also put some more light in difficult hanging situations.
Hello, today I am going to present a very intricate case I faced in my client’s Production database that caused loss of important SLAs, why it happened, and how to reproduce it.
In August 1st, a lot of important batch jobs ended up locked and ran much longer than expected, causing a chain of delays and resulting in less of SLAs, and consequently a request for a deep analysis to fill an RCA 🙂 .
So, I first started my analysis using an AWR report, and determined that during that specific point in time, almost 50% of the DB Time was spent in “enq: TM – contention”:
This is very unusual and for sure it was the cause of the slowness.
If you research you will easily find a lot of posts and notes highlighting the main cause os this wait event: the lack of an index in a child table’s FOREIGN KEY column.
I then searched in ASH (Active Session History) for all the statements waiting in the TM enqueue wait and this is what I’ve found:
(NOTE: the SQL statements were edited to show only the relevant part and preserve privacy).
Wow, all DMLs against the same table PGM!!! There must be a missing index in one of the FKs pointing to this table!
It’s also worth noting that one of the statements is a SHRINK in a materialized view log table MLOG$_PGM, also related to PGM table. This was triggered by a MV refresh.
So, the next step would be easy, right? Just find what was the missing index, create it and problem solved.
Hmmmm, not that fast. There was no missing indexes in any of the foreign keys. I searched using several different scripts, provided by Oracle, my owns, others found in Internet. Nothing: all pointed no index was missing for FKs.
So, what the heck?
I read in details the Note 1905174.1, that mention not only the lack of indexes, but also other not so popular causes of the TM event, like concurrent parallel DMLS executions.
Well, none of the possible causes mentioned there matched our situation. We really had a lot of DMLs running against the table, but they were all running serially. No parallel execution at all. So what?
So, at this point I have to say: I opened an SR with Oracle, provided all the information requested, along with my opinions, executed and provided outputs for all that (sorry, Oracle Support) nonsense scripts they usually ask us to run (many clearly not related to the problem). After several days and even weeks of interaction, the SR was closed with a proposed solution simply stating that the high concurrency in DMLs on the table was the cause of the issue.
This was not good enough, at least for me, as an explanation. So I kept researching.
Long story short, I the started to leverage some of my “magic” (ok, not that much 🙂 ) scripts to search for locks in the ASH history, for that particular period. I have made a new version of the script, to show the locks in an hierarchical fashion, just like the old utllockt.sql used to show (I will post this script right away in a new post). Here is what I found:
The rows at the bottom, with a blue background, are the DML statements waiting on the TM contention event.
The row with a red background is the SHRINK statement on the MV log table. Its SQL_ID 0jqznbwhur0p9 is an ALTER TABLE MLOG$_PGM SHRINK SPACE, that was triggered by the top level SQL_ID auyucv2czxffz which is a procedure that runs the refresh of the MV.
The rows nor highlighted are row lock contentions, not related to the issue being investigated.
And, most importantly, we can see that the top row, with an yellow background, is the one that is locking all the others below!
I was able to determine again checking ASH that that session was running a transaction since 14:36:33 at least, so probably locking a lot of rows. And it had indeed INSERTED rows into one of the PGM child tables:
select sql_id, sql_text
from dba_hist_active_sess_history a
left join dba_hist_sqltext t using (DBID, SQL_ID)
where snap_id between 68264 and 68265
and session_id=8359
and command_type != 3 --SELECT
and upper(sql_text) like '%PGM%';

SQL_ID        SQL_TEXT
------------- --------------------------------------------------------
5vdqb9jnwv0dm INSERT INTO PGM_ASSIGN ...

select xid, min(snap_id), min(sample_time)
from dba_hist_active_sess_history
where snap_id between 68000 and 68265
and xid = '1A040400D67B1300'
and session_id=8359
group by xid;

MIN(SNAP_ID) MIN(SAMPLE_TIME)
------------ -----------------
       68254 2023-08-01 14:36:33.173
Ok, so problem solved! It was that process at the top of the list, with module PB00M103, that was holding all the other sessions and caused the problem. RCA resolved!!! 🙂
But, wait! If there was no missing index on FK columns, no parallel DML execution, why in the world all that sessions (including that SHRINK on the MV log table) were waiting on enq: TM contention?
So, at this point if I was correct in my analysis, the following sequence of facts occurred:
A transaction was ongoing that inserted rows into a child table (PGM_ASSIGN).
Other transactions tried to modify rows into the parent table and got locked (enq: row lock contention).
A MV refresh was issued, triggered a SHRINK in the MV log table, and was locked (enq: TM contention).
If I was correct, I could probably reproduce the steps with a test case, and maybe a new situation that causes the TM contention was discovered. At least for me, because I could not find any reference in the Internet, anywhere, pointing to that. If you can find something, please let me klnow.
So, I started to try create a test case that could reproduce the situation at will and proof my point.
After several tries and a lot of time, I finally was able to reproduce it with the steps I present here.
I was able to reproduce the issue both in 23c FREE and in 19c.
I am not saying that this is a bug, I guess this is probably expected behavior, but I could not find any documentation about it. I will open an SR to request it to be documented or a more detailed explanation.
So, first, lets create my objects and some fake data. Please notice that I am using some IF EXISTS and IF NOT EXISTS. If I’m nor wrong, this was implemented in 21c. So if you are using an older version, remove these clauses before running:
drop table if exists t_child;

Table dropped.

drop table if exists T;

Table dropped.

create table if NOT exists t nologging as
select level as ID, lpad('x',500,'x') as MYTEXT
from dual
connect by level <= 1000;

Table created.

alter table T add constraint PK_T primary key (id);

Table altered.

create table t_child
as select id from T where 1=2;

Table created.

alter table t_child add constraint FK_T foreign key (id) references T;

Table altered.

create index if not exists I_child_ID on t_child (id);

Index created.

create materialized view log on T with primary key;

Materialized view log created.

drop materialized view if exists mv_t;

Materialized view dropped.

create materialized view mv_t refresh fast as select * from t;

Materialized view created.
I also executed another statement, that allows ROW MOVEMENT on the MV log table. In my tests, without this it seems the SHRING is not triggered as part of the MV refresh, and so the situation I want to show does not happen:
alter table MLOG$_T enable row movement;

Table altered.
Now, we will need 5 sessions: 4 to have separate transactions running, and the 5th to monitor the others.
Session 1
In this session, I will intentionally execute and commit a first transaction just to have something created in the MV Log of my table T. In my tests, without this first transaction, the SHRINK triggered by the MVIEW refresh actually has nothing to do so it ends up not being locked as we want to see.
Then, I start a second transaction which inserts a row in the child table:
update T set mytext= lpad('y',500,'y') where id between 2 and 100;

99 rows updated.

commit;

Commit complete.

insert into T_child select id from T where id=1;

1 row created.
Session 2
Here in the Session 2, I will issue a DELETE against the parent table, for the same row that I inserted a child in Session 1.
This DELETE statement will be locked with enq: TX – row lock contention, because if the Session 1 commits the child record, this DELETE should result in a referential integrity error.
delete from T where id=1;
-- This will be locked
Monitoring Session
Let us see what is happening so far:
select sid, event, blocking_session, sql_id, sql_text
from v$session s join v$sqlarea a using (sql_id)
where username=user and status='ACTIVE' and sid<>userenv('sid');

   SID EVENT                                    BLOCKING_SESSION SQL_ID        SQL_TEXT
------ ---------------------------------------- ---------------- ------------- ----------------------------------------------------------------
    51 enq: TX - row lock contention                         315 gq0nm7h7znaqg delete from T where id=1

1 row selected.
My Session 2 (SID 51) is locked by Session1 (SID 315), waiting on row lock contention.
Session 3
Now is the show time!
Let’s see if I can really reproduce the same situation, and have the MV refresh waiting on enq: TM contention.
Plase note, very important: the indexe I_CHILD_FK was created on T_CHILD.ID. So, my FK has a proper index!
alter table MLOG$_T shrink space;
-- This will be locked
-- You could also run: ALTER MATERIALIZED VIEW LOG ON t SHRINK SPACE;
Monitoring Session
Let’s see again what is happening:
select sid, event, blocking_session, sql_id, sql_text
from v$session s join v$sqlarea a using (sql_id)
where username=user and status='ACTIVE' and sid<>userenv('sid');

   SID EVENT                                    BLOCKING_SESSION SQL_ID        SQL_TEXT
------ ---------------------------------------- ---------------- ------------- ----------------------------------------------------------------
    51 enq: TX - row lock contention                         315 gq0nm7h7znaqg delete from T where id=1
   299 enq: TM - contention                                   51 2tdwh27m73j2h alter table MLOG$_T shrink space

2 rows selected.
Now, we have my Session 3 (SID 299) locked by Session 2 (SID 51), WAITING ON THE ‘enq: TM – enqueue’ event.
Session 4
The worst part of the story happens NOW!
Since the MV Log table is locked for a SHRINK, all other DMLs against the main table WILL BE LOCKED as well, on enq: TM – contention.
Note below, I try to update a different row on T, but since this change must be logged in the MLOG$_T table for future refresh of the MV, and this MV log table is locked, my update will be locked. as well:
update T set mytext='a' where id=2;
-- This will be locked
Monitoring Session
Let’s see the final situation:
select sid, event, blocking_session, sql_id, sql_text
from v$session s join v$sqlarea a using (sql_id)
where username=user and status='ACTIVE' and sid<>userenv('sid');

   SID EVENT                                    BLOCKING_SESSION SQL_ID        SQL_TEXT
------ ---------------------------------------- ---------------- ------------- ----------------------------------------------------------------
    51 enq: TX - row lock contention                         315 gq0nm7h7znaqg delete from T where id=1
   299 enq: TM - contention                                   51 2tdwh27m73j2h alter table MLOG$_T shrink space
   305 enq: TM - contention                                  299 9tx4g651scvud update T set mytext='a' where id=2

3 rows selected.
We can see that my Session 4 (SID 305) is locked by Session 3 (SID 299) also waiting on TM contention.
Conculsion
So, I was able to successfully reproduce the situation that I presented and happened in my client’s Production database.
A SHRINK SPACE on a MV log table, issued by the MV refresh, can wait on the TM enqueue event. And after that, all other sessions trying to DML on that table will be locked too.
The only piece that I could not reproduce 100% was calling the MV refresh and having it indirectly issuing the SHRINK. I know for a fact that this was the case, but unfortunately I got inconsistent results when trying to get it using my test case. I’m not sure if it’s some particular parameter of the MV or the MV log that would make it call the shrink when refreshing. I know there is a hidden parameter _mv_refresh_shrink_log that controls it, but both in my client’s Production and in my test environments it was set to TRUE, which is the default, so it was not it. That’s why in my test case I called the shrink directly instead.
If anybody can help me on that part, that would be very much appreciated.
And again, I could not find any mention to that situation anywhere online, even in MOS.
In order to troubleshoot a lock issue, I needed to try to DELETE a row from a table that is referenced by a lot of FOREIGN KEY constraints.
I just wanted to delete a row from the parent table, not worrying about childs. So, for my test, it would be good to find a row to delete that has no child rows in ANY of the child tables (which have the referencing FKs).
Yes, you can easily determine that by issuing a query like this:
SELECT *
FROM PARENT_TABLE P
WHERE NOT EXISTS (SELECT 1 FROM CHILD_TABLE C WHERE C.COLUMN = P.COLUMN)
You can easily find many references and examples on how to use that by googling it.
But, since for my case I have more than 20 FKs pointing to the parent table (really!), I did not want to build the query manually with lots of NOT EXISTS. So it would be great to create a script to automate that. And this is what I present here.
So, the script I’m presenting will provide you with the complete query to find records in a parent table that has no child records in ANY of their child tables. Then, you just need to execute the provided script and you will find that rows.
Let me then start by creating some tables, constraints and data in order to show the script working:
Please note that I’ve created the parent table with a composed primary key, just to show that this case is covered as well.
As you can see above, the PARENT records with IDs (1,1) , (2,2) and (5,5) have child records (the first two in the child table CHILD1 and the last in CHILD2), while the records (3,3) , (4,4) and (6,6) have no child.
Here is the the script that creates the query to return the parents without childs, and the query returned:
define rown=CLAROE
define rtab=PARENT

select
	case
		when rownum=1 then 'select * from ' || r_owner || '.' || r_table_name || ' PARENT' || chr(10) || 'where not exists '
		when position=1 then 'and not exists '
	end ||
	case
		when position = 1 then
			chr(10) || '  (select 1 from ' || owner || '.' || table_name || ' CHILD ' || chr(10) || '   where '
		else '   and '
	end ||
	'CHILD.' || column_name || '=PARENT.' || r_column_name ||
	case when position = max_position then ')' end
	as STATEMENT
from (
	select col.owner, col.table_name, col.column_name, con.r_owner,
		rcon.table_name as r_table_name, rcol.column_name r_column_name, col.position,
		max(col.position) over (partition by col.owner, col.table_name, col.constraint_name) max_position
	from
		all_cons_columns col
		join all_constraints con
			on col.owner=con.owner
			and col.table_name=con.table_name
			and col.constraint_name=con.constraint_name
		left join all_constraints rcon
			on rcon.owner = con.r_owner and rcon.constraint_name = con.r_constraint_name
		left join all_cons_columns rcol
			on rcol.owner=rcon.owner
			and rcol.table_name=rcon.table_name
			and rcol.constraint_name=rcon.constraint_name
			and rcol.position = col.position
	where con.r_owner = '&rown'
	and rcon.table_name = '&rtab'
	and rcon.status = 'ENABLED'
	order by col.owner, col.table_name, col.constraint_name, col.position
);

STATEMENT
-----------------------------------------------------------------------------
select * from CLAROE.PARENT PARENT
where not exists
  (select 1 from CLAROE.CHILD1 CHILD
   where CHILD.PARENT_ID1=PARENT.ID1
   and CHILD.PARENT_ID2=PARENT.ID2)
and not exists
  (select 1 from CLAROE.CHILD2 CHILD
   where CHILD.PARENT_ID1=PARENT.ID1
   and CHILD.PARENT_ID2=PARENT.ID2)
Now here I will execute the query to find the records:
select * from CLAROE.PARENT PARENT
where not exists
  (select 1 from CLAROE.CHILD1 CHILD
   where CHILD.PARENT_ID1=PARENT.ID1
   and CHILD.PARENT_ID2=PARENT.ID2)
and not exists
  (select 1 from CLAROE.CHILD2 CHILD
   where CHILD.PARENT_ID1=PARENT.ID1
   and CHILD.PARENT_ID2=PARENT.ID2);

       ID1        ID2 TEXT
---------- ---------- --------------------
         6          6 no child
         4          4 no child
         3          3 no child

3 rows selected.
Perfect! As expected, the query returned the rows (3,3) , (4,4) and (6,6) , which are exactly those without child records.
Please, be aware that the query can take a lot of time to execute if your tables are huge and you have lots of child tables.